Estimated Value: $80,000 - $181,149
2
Beds
2
Baths
1,900
Sq Ft
$76/Sq Ft
Est. Value
About This Home
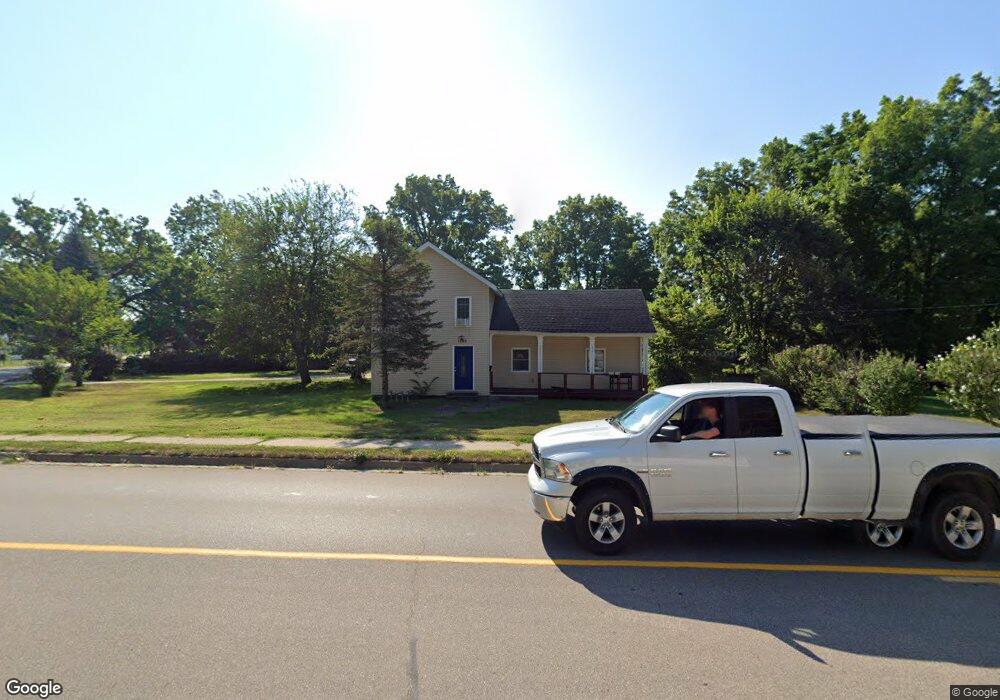
This home is located at 1325 N 5th St, Niles, MI 49120 and is currently estimated at $144,037, approximately $75 per square foot. 1325 N 5th St is a home located in Berrien County with nearby schools including James Ellis School, Howard-Ellis Elementary School, and Ring Lardner Middle School.
Ownership History
Date
Name
Owned For
Owner Type
Purchase Details
Closed on
Jul 1, 2024
Sold by
Barron Laura Mota
Bought by
Ventura-Jose Efrain
Current Estimated Value
Purchase Details
Closed on
May 9, 2017
Sold by
Moran James and Moran Jim
Bought by
Barron Laura Motu
Purchase Details
Closed on
Aug 7, 2015
Sold by
Peugh Ken
Bought by
Moran Jim
Purchase Details
Closed on
Mar 12, 2014
Sold by
Hines Travis Lee and Hines Jamie Lee
Bought by
Peugh Ken
Purchase Details
Closed on
Oct 25, 2012
Sold by
Mcbeen Brian and Mcbeen Elizabeth J
Bought by
Hines Travis Lee and Hines Jamie Lee
Purchase Details
Closed on
Dec 4, 2008
Sold by
Hall Wendy L
Bought by
Mcbeen Brian and Mcbeen Elizabeth J
Purchase Details
Closed on
Sep 2, 2004
Sold by
Broyles Gloria
Bought by
Norwest Bank Minnesota Na and Southern Pacific Secured Assets Corp Mor
Purchase Details
Closed on
Jan 27, 2000
Purchase Details
Closed on
Jun 27, 1997
Purchase Details
Closed on
Jan 21, 1994
Purchase Details
Closed on
Apr 15, 1985
Create a Home Valuation Report for This Property
The Home Valuation Report is an in-depth analysis detailing your home's value as well as a comparison with similar homes in the area
Home Values in the Area
Average Home Value in this Area
Purchase History
| Date | Buyer | Sale Price | Title Company |
|---|---|---|---|
| Ventura-Jose Efrain | -- | None Listed On Document | |
| Barron Laura Motu | $12,500 | Attorney | |
| Moran Jim | $15,000 | Mtc | |
| Peugh Ken | $5,000 | None Available | |
| Hines Travis Lee | $11,000 | None Available | |
| Mcbeen Brian | $16,000 | Itc | |
| Norwest Bank Minnesota Na | $18,364 | -- | |
| -- | $32,800 | -- | |
| -- | $41,700 | -- | |
| -- | $29,900 | -- | |
| -- | -- | -- |
Source: Public Records
Tax History Compared to Growth
Tax History
| Year | Tax Paid | Tax Assessment Tax Assessment Total Assessment is a certain percentage of the fair market value that is determined by local assessors to be the total taxable value of land and additions on the property. | Land | Improvement |
|---|---|---|---|---|
| 2025 | $2,304 | $42,900 | $0 | $0 |
| 2024 | $735 | $41,100 | $0 | $0 |
| 2023 | $705 | $33,600 | $0 | $0 |
| 2022 | $671 | $25,400 | $0 | $0 |
| 2021 | $1,226 | $23,900 | $6,100 | $17,800 |
| 2020 | $1,211 | $23,500 | $0 | $0 |
| 2019 | $1,194 | $20,500 | $5,200 | $15,300 |
| 2018 | $1,082 | $20,500 | $0 | $0 |
| 2017 | $1,069 | $23,300 | $0 | $0 |
| 2016 | $1,135 | $17,200 | $0 | $0 |
| 2015 | $2,177 | $34,500 | $0 | $0 |
| 2014 | $923 | $30,900 | $0 | $0 |
Source: Public Records
Map
Nearby Homes
- 1201 N 6th St
- 1603 N 5th St
- 1610 N 5th St
- 2802 Primrose Ct
- 232 Pokagon St
- 712 Wayne St
- 1630 Forest Trail
- 501 & 505 N Twelfth St
- 98 River St
- 645 N 11th St
- 1123 N 9th St
- 626 N 12th St
- 1405 Sheffield Ave
- 622 N 13th St
- 810 Ferry St
- 534 James St
- 8 Marmont St
- 1314 Ferry St
- 31829 Heritage Place
- 211 N 8th St