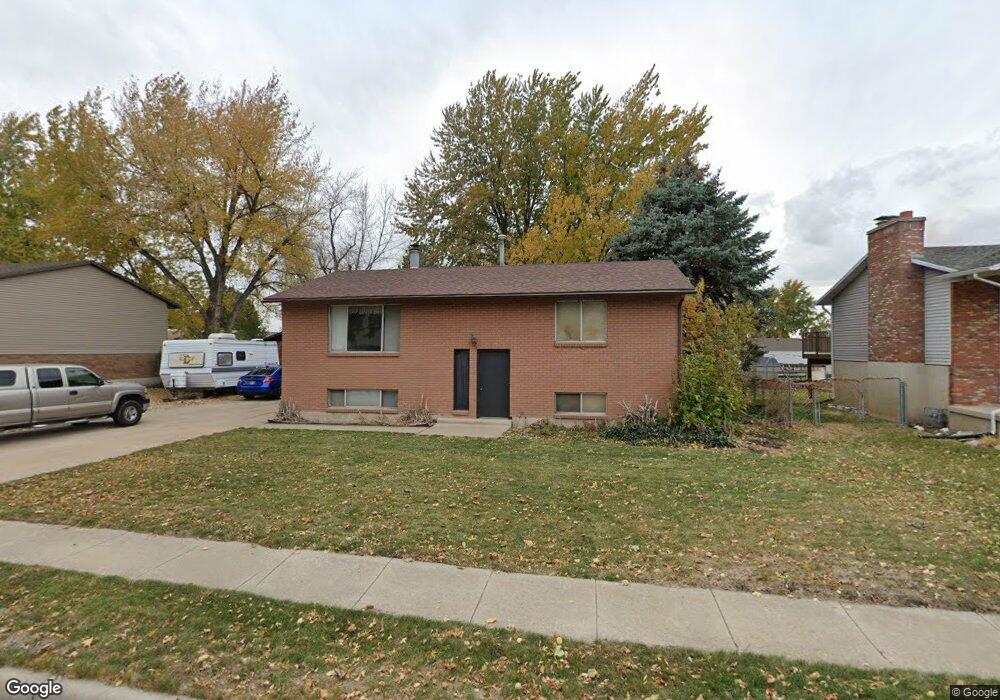
1325 N 675 W West Bountiful, UT 84087
Estimated Value: $463,000 - $529,000
2
Beds
1
Bath
1,107
Sq Ft
$437/Sq Ft
Est. Value
About This Home
This home is located at 1325 N 675 W, West Bountiful, UT 84087 and is currently estimated at $484,273, approximately $437 per square foot. 1325 N 675 W is a home located in Davis County with nearby schools including West Bountiful Elementary School, Bountiful Junior High School, and Viewmont High School.
Ownership History
Date
Name
Owned For
Owner Type
Purchase Details
Closed on
Mar 31, 2003
Sold by
Walker Steven B and Walker Joan
Bought by
Thompson Craig J
Current Estimated Value
Home Financials for this Owner
Home Financials are based on the most recent Mortgage that was taken out on this home.
Original Mortgage
$124,800
Outstanding Balance
$53,731
Interest Rate
5.78%
Estimated Equity
$430,542
Purchase Details
Closed on
Jul 6, 2001
Sold by
Walker Steven B
Bought by
Walker Steven B and Walker Joan
Purchase Details
Closed on
Jun 22, 2001
Sold by
Thompson Craig John and Thompson Glenn Clayton
Bought by
Walker Steven B
Purchase Details
Closed on
Dec 30, 1998
Sold by
Thompson Craig John
Bought by
Thompson Craig John and Thompson Glenn Clayton
Purchase Details
Closed on
Jun 12, 1996
Sold by
Thompson Joan H and Thompson Joan
Bought by
Thompson Craig John
Create a Home Valuation Report for This Property
The Home Valuation Report is an in-depth analysis detailing your home's value as well as a comparison with similar homes in the area
Home Values in the Area
Average Home Value in this Area
Purchase History
| Date | Buyer | Sale Price | Title Company |
|---|---|---|---|
| Thompson Craig J | -- | Inwest Title Services Inc | |
| Walker Steven B | -- | Bonneville Title Company Inc | |
| Walker Steven B | -- | Bonneville Title Company | |
| Thompson Craig John | -- | -- | |
| Thompson Craig John | -- | Backman Stewart Title Servic |
Source: Public Records
Mortgage History
| Date | Status | Borrower | Loan Amount |
|---|---|---|---|
| Open | Thompson Craig J | $124,800 |
Source: Public Records
Tax History Compared to Growth
Tax History
| Year | Tax Paid | Tax Assessment Tax Assessment Total Assessment is a certain percentage of the fair market value that is determined by local assessors to be the total taxable value of land and additions on the property. | Land | Improvement |
|---|---|---|---|---|
| 2024 | $2,642 | $231,000 | $111,128 | $119,872 |
| 2023 | $2,530 | $407,000 | $211,154 | $195,846 |
| 2022 | $2,580 | $232,650 | $100,547 | $132,103 |
| 2021 | $2,304 | $318,000 | $134,296 | $183,704 |
| 2020 | $1,982 | $269,000 | $125,662 | $143,338 |
| 2019 | $1,953 | $263,000 | $127,637 | $135,363 |
| 2018 | $1,839 | $244,000 | $129,136 | $114,864 |
| 2016 | $1,531 | $110,605 | $32,621 | $77,984 |
| 2015 | $1,476 | $101,640 | $32,621 | $69,019 |
| 2014 | $1,462 | $104,022 | $32,621 | $71,401 |
| 2013 | -- | $97,260 | $28,676 | $68,584 |
Source: Public Records
Map
Nearby Homes
- 741 W 845 N
- Hampton Traditional Plan at Belmont Farms
- Belmont Traditional Plan at Belmont Farms
- Lincoln Farmhouse Plan at Belmont Farms
- 790 N 500 W
- 706 W 1950 N
- 234 W 1350 N
- 235 W 1000 N
- 585 W 2125 N
- 1410 N 200 W
- 1194 N 200 W
- 1260 N 200 W
- 1084 W Audrey Ln
- 1084 W Audrey Ln Unit 20
- 380 N 500 W Unit 103
- 234 Leah Cir
- 1680 N Aliwood Way W
- 399 W 400 N Unit 47
- 775 W 220 N
- 379 W 400 N Unit 6