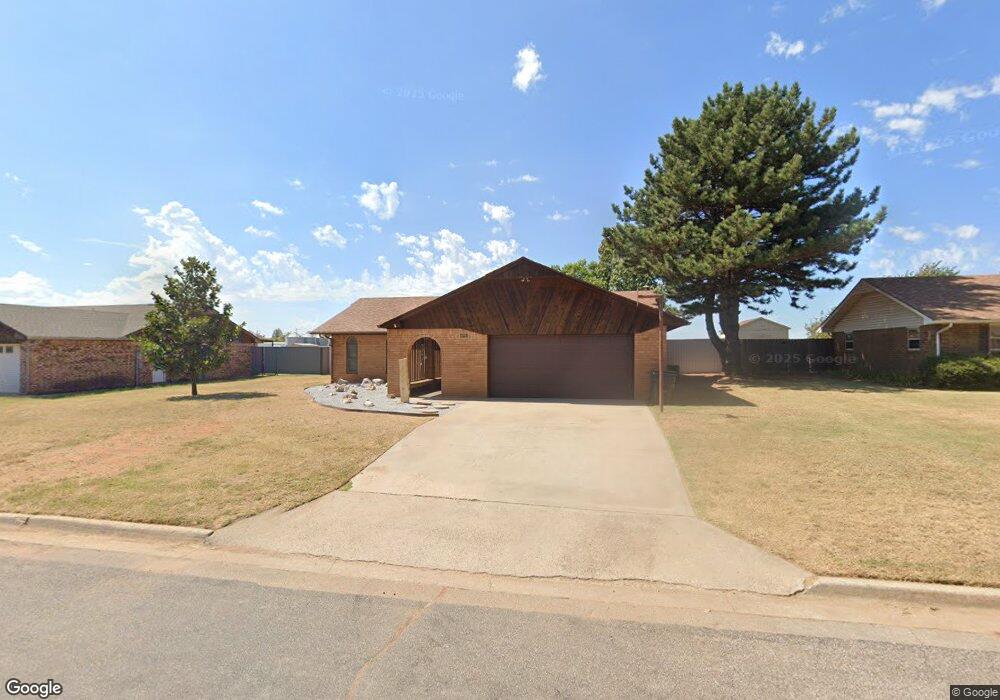
1325 N Maple St Seiling, OK 73663
Estimated Value: $130,000 - $163,000
3
Beds
2
Baths
1,400
Sq Ft
$103/Sq Ft
Est. Value
About This Home
This home is located at 1325 N Maple St, Seiling, OK 73663 and is currently estimated at $144,790, approximately $103 per square foot. 1325 N Maple St is a home located in Dewey County with nearby schools including Seiling Elementary School, Seiling Junior High School, and Seiling Senior High School.
Ownership History
Date
Name
Owned For
Owner Type
Purchase Details
Closed on
Apr 17, 2025
Sold by
Fke Properties Llc
Bought by
Elmore Nita
Current Estimated Value
Purchase Details
Closed on
Aug 16, 2024
Sold by
Barnes Charles A
Bought by
Fke Properties Llc
Home Financials for this Owner
Home Financials are based on the most recent Mortgage that was taken out on this home.
Original Mortgage
$100,109
Interest Rate
0.56%
Mortgage Type
Construction
Create a Home Valuation Report for This Property
The Home Valuation Report is an in-depth analysis detailing your home's value as well as a comparison with similar homes in the area
Purchase History
| Date | Buyer | Sale Price | Title Company |
|---|---|---|---|
| Elmore Nita | $152,000 | Woodward Cnty Abstract Co | |
| Fke Properties Llc | $123,000 | Woodward Cnty Abstract Co |
Source: Public Records
Mortgage History
| Date | Status | Borrower | Loan Amount |
|---|---|---|---|
| Previous Owner | Fke Properties Llc | $100,109 |
Source: Public Records
Tax History
| Year | Tax Paid | Tax Assessment Tax Assessment Total Assessment is a certain percentage of the fair market value that is determined by local assessors to be the total taxable value of land and additions on the property. | Land | Improvement |
|---|---|---|---|---|
| 2025 | $1,076 | $13,530 | $1,069 | $12,461 |
| 2024 | $10 | $12,377 | $963 | $11,414 |
| 2023 | $949 | $12,378 | $979 | $11,399 |
| 2022 | $968 | $11,227 | $889 | $10,338 |
| 2021 | $899 | $10,692 | $860 | $9,832 |
| 2020 | $819 | $10,183 | $803 | $9,380 |
| 2019 | $782 | $9,699 | $749 | $8,950 |
| 2018 | $763 | $9,236 | $740 | $8,496 |
| 2017 | $768 | $8,796 | $689 | $8,107 |
| 2016 | $529 | $8,378 | $783 | $7,595 |
| 2015 | $453 | $7,978 | $560 | $7,418 |
| 2014 | $439 | $7,747 | $609 | $7,138 |
Source: Public Records
Map
Nearby Homes
- 1404 N Oak
- 1408 N Oak
- 615 W County Line Rd
- 307 County Line Rd
- 520 N Locust St
- 410 N Walnut St
- 205 N Maple
- 236198 E County Road 58
- 46864 U S 270
- 114 E Hamar Ave
- 0 Broadway
- 114 Francis St
- E 500 Rd
- TBD E 500 Rd
- Tract 4 E0480 Rd
- Tract 2 E0480 Rd
- Tract 3 E0480 Rd
- Chester Area
- 51024 S County Road 218
- E0480 Road
Your Personal Tour Guide
Ask me questions while you tour the home.