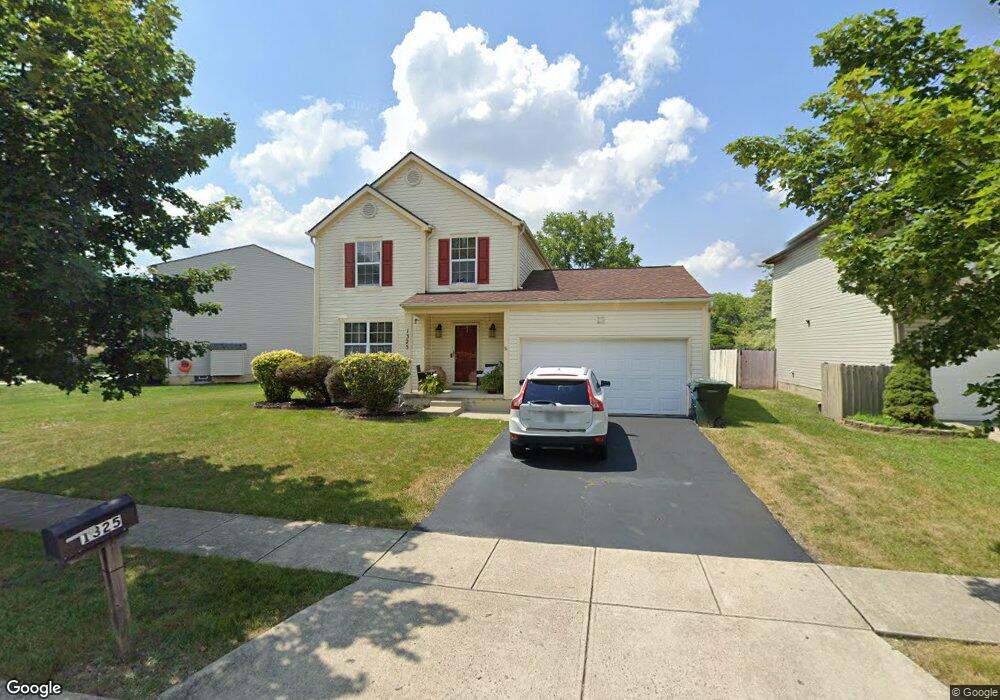
1325 Onslow Dr Columbus, OH 43204
Brookshire NeighborhoodEstimated Value: $274,000 - $318,000
3
Beds
2
Baths
1,536
Sq Ft
$187/Sq Ft
Est. Value
About This Home
This home is located at 1325 Onslow Dr, Columbus, OH 43204 and is currently estimated at $287,090, approximately $186 per square foot. 1325 Onslow Dr is a home located in Franklin County with nearby schools including West Franklin Elementary School, Franklin Woods Intermediate School, and Finland Middle School.
Ownership History
Date
Name
Owned For
Owner Type
Purchase Details
Closed on
Oct 31, 1997
Sold by
S A R Construction Co
Bought by
Jackson Michelle E
Current Estimated Value
Home Financials for this Owner
Home Financials are based on the most recent Mortgage that was taken out on this home.
Original Mortgage
$131,228
Outstanding Balance
$21,803
Interest Rate
7.42%
Mortgage Type
VA
Estimated Equity
$265,287
Purchase Details
Closed on
Feb 24, 1997
Sold by
Mitran Land Ltd Liabilit
Bought by
S A R Const
Home Financials for this Owner
Home Financials are based on the most recent Mortgage that was taken out on this home.
Original Mortgage
$104,480
Interest Rate
7.92%
Mortgage Type
New Conventional
Purchase Details
Closed on
Jan 15, 1997
Sold by
Homewood Corp
Bought by
Mitran Land Ltd Liability Co
Home Financials for this Owner
Home Financials are based on the most recent Mortgage that was taken out on this home.
Original Mortgage
$104,480
Interest Rate
7.92%
Mortgage Type
New Conventional
Create a Home Valuation Report for This Property
The Home Valuation Report is an in-depth analysis detailing your home's value as well as a comparison with similar homes in the area
Home Values in the Area
Average Home Value in this Area
Purchase History
| Date | Buyer | Sale Price | Title Company |
|---|---|---|---|
| Jackson Michelle E | $131,300 | Hummel Title Agency Inc | |
| S A R Const | $18,000 | -- | |
| Mitran Land Ltd Liability Co | $17,800 | -- |
Source: Public Records
Mortgage History
| Date | Status | Borrower | Loan Amount |
|---|---|---|---|
| Open | Jackson Michelle E | $131,228 | |
| Previous Owner | S A R Const | $104,480 |
Source: Public Records
Tax History Compared to Growth
Tax History
| Year | Tax Paid | Tax Assessment Tax Assessment Total Assessment is a certain percentage of the fair market value that is determined by local assessors to be the total taxable value of land and additions on the property. | Land | Improvement |
|---|---|---|---|---|
| 2024 | $2,952 | $80,960 | $22,230 | $58,730 |
| 2023 | $2,900 | $80,955 | $22,225 | $58,730 |
| 2022 | $2,369 | $48,550 | $8,400 | $40,150 |
| 2021 | $2,417 | $48,550 | $8,400 | $40,150 |
| 2020 | $2,403 | $48,550 | $8,400 | $40,150 |
| 2019 | $2,203 | $39,270 | $7,000 | $32,270 |
| 2018 | $2,210 | $39,270 | $7,000 | $32,270 |
| 2017 | $2,205 | $39,270 | $7,000 | $32,270 |
| 2016 | $2,228 | $36,820 | $6,650 | $30,170 |
| 2015 | $2,228 | $36,820 | $6,650 | $30,170 |
| 2014 | $2,230 | $36,820 | $6,650 | $30,170 |
| 2013 | $1,229 | $40,915 | $7,385 | $33,530 |
Source: Public Records
Map
Nearby Homes
- 1181 Onslow Dr
- 1465 Tall Meadows Dr
- 1226 Pinnacle Dr
- 2987 Daisy Ln
- 3488 Rocky Rd
- 1027 S Brinker Ave
- 1248 Gresham Rd
- 3360 Briggs Rd
- 3623 High Creek Dr
- 2929 Briggs Rd
- 1037 Chestershire Rd
- 1657 Ripplebrook Rd
- 1520 Fall Brook Rd
- 3318 Miriam Dr S
- 2856 Chesfield Dr
- 3326 Bluhm Ct
- 3029 Rosedale Ave
- 898 Binns Blvd
- 894 Binns Blvd
- 890 S Roys Ave
- 1331 Onslow Dr
- 1313 Onslow Dr
- 1313 Onslow Dr Unit 1
- 3338 Emeline Dr
- 3341 Riegelwood Ct
- 3344 Emeline Dr
- 3349 Riegelwood Ct
- 1305 Onslow Dr
- 1320 Onslow Dr
- 1328 Onslow Dr
- 1336 Onslow Dr
- 1312 Onslow Dr
- 3350 Emeline Dr
- 1363 Restwood Ct
- 1297 Onslow Dr
- 1304 Onslow Dr
- 3336 Riegelwood Ct
- 1370 Restwood Ct
- 3355 Riegelwood Ct
- 3356 Emeline Dr