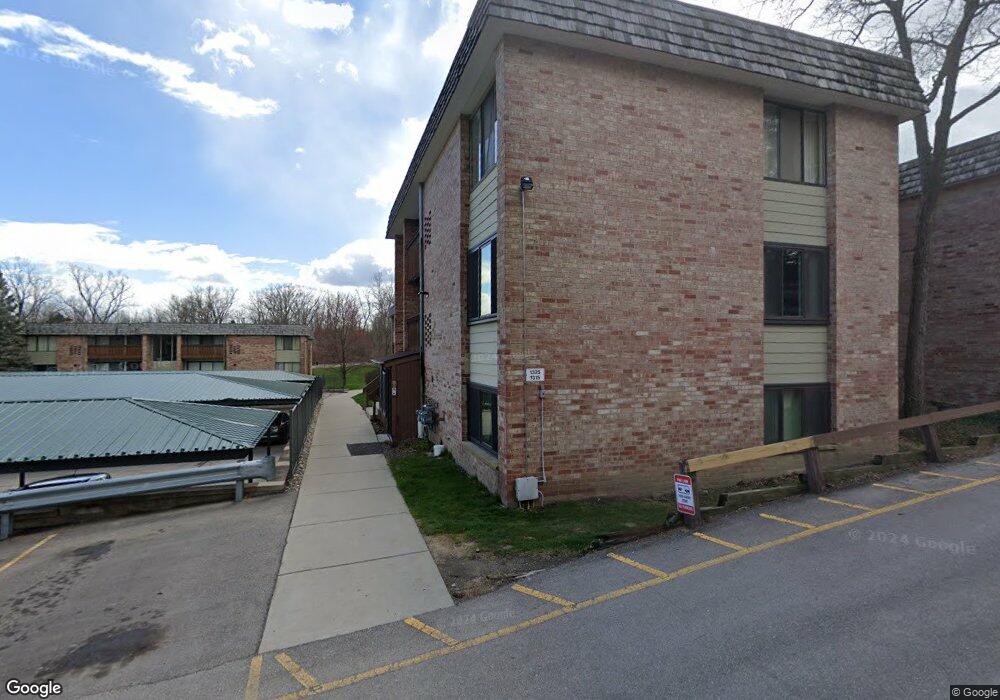
1325 S Maple Rd Ann Arbor, MI 48103
South Maple NeighborhoodEstimated Value: $164,000 - $188,000
2
Beds
1
Bath
1,200
Sq Ft
$146/Sq Ft
Est. Value
About This Home
THIS UNIT WILL BE AVAILABLE FOR MOVE IN ON 5/1/22
Please do not ask for a later date, if you are reading this that means the unit is available to move in NOW, not later.
This large 2 bed, 2 bath has hardwood thru-out with tile in the kitchen and dining room. Features include an indoor swimming pool with 24 hr fitness center, assigned covered parking with a walk out patio. This whole unit was remodeled 3 years ago with new appliances, fixtures, and HVAC. Located very close to downtown Ann Arbor with all shopping just minutes away, many amenities within walking distance.
Dogs are welcome
We also offer short term leases as well.
Rent is $1600 a/mo
Ownership History
Date
Name
Owned For
Owner Type
Purchase Details
Closed on
Jun 30, 2023
Sold by
Iott Mark J
Bought by
Ranu Rahimun Nessa
Current Estimated Value
Purchase Details
Closed on
Apr 14, 2017
Sold by
Property At Maple Llc
Bought by
Iott Mark J
Purchase Details
Closed on
Feb 20, 2014
Sold by
Property At Pauline Llc
Bought by
Property At Maple Llc
Purchase Details
Closed on
Sep 10, 2013
Sold by
Property At Pauline Llc
Bought by
Property At Maple Llc
Purchase Details
Closed on
Feb 6, 2013
Sold by
Cvercko Dennis M and Cvercko Sandra L
Bought by
Property At Pauline Llc
Purchase Details
Closed on
Jan 28, 2013
Sold by
Pollard Richard J and The Dorothy L Pollard Revocabl
Bought by
Cvercko Dennis M and Cvercko Sandra L
Create a Home Valuation Report for This Property
The Home Valuation Report is an in-depth analysis detailing your home's value as well as a comparison with similar homes in the area
Home Values in the Area
Average Home Value in this Area
Purchase History
| Date | Buyer | Sale Price | Title Company |
|---|---|---|---|
| Ranu Rahimun Nessa | $175,000 | None Listed On Document | |
| Iott Mark J | $93,000 | None Available | |
| Property At Maple Llc | -- | None Available | |
| Property At Maple Llc | -- | None Available | |
| Property At Pauline Llc | -- | Liberty Title | |
| Cvercko Dennis M | $70,000 | Liberty Title |
Source: Public Records
Property History
| Date | Event | Price | List to Sale | Price per Sq Ft |
|---|---|---|---|---|
| 05/18/2022 05/18/22 | For Rent | $1,600 | -- | -- |
Tax History
| Year | Tax Paid | Tax Assessment Tax Assessment Total Assessment is a certain percentage of the fair market value that is determined by local assessors to be the total taxable value of land and additions on the property. | Land | Improvement |
|---|---|---|---|---|
| 2025 | $3,884 | $85,500 | $0 | $0 |
| 2024 | $3,788 | $82,500 | $0 | $0 |
| 2023 | $2,384 | $77,900 | $0 | $0 |
| 2022 | $2,535 | $72,200 | $0 | $0 |
| 2021 | $2,475 | $72,000 | $0 | $0 |
| 2020 | $2,425 | $58,600 | $0 | $0 |
| 2019 | $2,308 | $49,600 | $49,600 | $0 |
| 2018 | $2,275 | $45,600 | $0 | $0 |
| 2017 | $1,824 | $45,000 | $0 | $0 |
| 2016 | $1,802 | $36,481 | $0 | $0 |
| 2015 | $2,165 | $36,372 | $0 | $0 |
| 2014 | $2,165 | $30,617 | $0 | $0 |
| 2013 | -- | $30,617 | $0 | $0 |
Source: Public Records
Map
Nearby Homes
- 2124 Pauline Blvd Unit 307
- 2132 Pauline Blvd Unit 308
- 2157 Pauline Ct Unit 1
- 1225 S Maple Rd Unit 307
- 1265 S Maple Rd Unit 206
- 1235 S Maple Rd Unit 101
- 1235 S Maple Rd Unit 302
- 1215 S Maple Rd Unit 202
- 2104 Pauline Blvd Unit 305
- 2205 Runnymede Blvd
- 1937 Alhambra Dr
- 2521 Country Village Ct Unit 8
- 1631 Dicken Dr
- 1062 W Summerfield Glen Cir Unit 70
- 2509 W Liberty St
- 922 W Summerfield Glen Cir Unit 110
- 2597 W Towne St
- 2591 W Towne St
- 2667 Oxford Cir
- 1343 Timmins Dr Unit 8
- 1325 S Maple Rd Unit 303
- 1325 S Maple Rd Unit 101
- 1325 S Maple Rd Unit 104
- 1325 S Maple Rd Unit 204
- 1325 S Maple Rd Unit 203
- 1325 S Maple Rd Unit 201
- 1325 S Maple Rd Unit 302
- 1325 S Maple Rd Unit 304
- 1325 S Maple Rd Unit 301
- 1325 S Maple Rd Unit 202
- 1325 S Maple Rd Unit 103
- 1325 S Maple Rd Unit 102
- 1325 S Maple Rd
- 1325 S Maple Rd Unit 202
- 1325 S Maple Rd
- 1315 S Maple Rd Unit 305
- 1315 S Maple Rd Unit 307
- 1315 S Maple Rd Unit 208
- 1315 S Maple Rd Unit 206
- 1315 S Maple Rd Unit 308
Your Personal Tour Guide
Ask me questions while you tour the home.