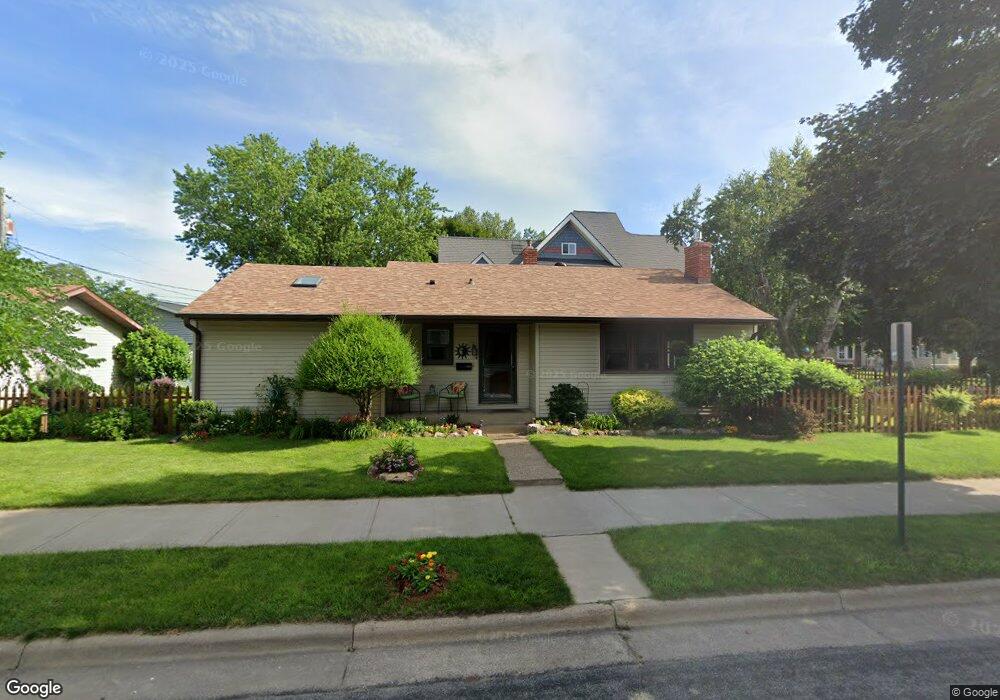
1325 Sill St La Crosse, WI 54603
Logan Northside NeighborhoodEstimated Value: $174,000 - $215,000
2
Beds
1
Bath
1,164
Sq Ft
$175/Sq Ft
Est. Value
About This Home
This home is located at 1325 Sill St, La Crosse, WI 54603 and is currently estimated at $203,803, approximately $175 per square foot. 1325 Sill St is a home located in La Crosse County with nearby schools including Northside Elementary School, Logan Middle School, and Logan High School.
Ownership History
Date
Name
Owned For
Owner Type
Purchase Details
Closed on
Aug 7, 2012
Sold by
Park Bank
Bought by
Novak Karen L
Current Estimated Value
Home Financials for this Owner
Home Financials are based on the most recent Mortgage that was taken out on this home.
Original Mortgage
$71,500
Outstanding Balance
$49,485
Interest Rate
3.65%
Mortgage Type
New Conventional
Estimated Equity
$154,318
Purchase Details
Closed on
Jun 4, 2011
Sold by
Barth David R and Barth Kristin P
Bought by
Park Bank
Create a Home Valuation Report for This Property
The Home Valuation Report is an in-depth analysis detailing your home's value as well as a comparison with similar homes in the area
Home Values in the Area
Average Home Value in this Area
Purchase History
| Date | Buyer | Sale Price | Title Company |
|---|---|---|---|
| Novak Karen L | $76,400 | None Available | |
| Park Bank | $39,568 | None Available |
Source: Public Records
Mortgage History
| Date | Status | Borrower | Loan Amount |
|---|---|---|---|
| Open | Novak Karen L | $71,500 |
Source: Public Records
Tax History Compared to Growth
Tax History
| Year | Tax Paid | Tax Assessment Tax Assessment Total Assessment is a certain percentage of the fair market value that is determined by local assessors to be the total taxable value of land and additions on the property. | Land | Improvement |
|---|---|---|---|---|
| 2023 | $2,586 | $141,600 | $20,000 | $121,600 |
| 2022 | $2,493 | $141,600 | $20,000 | $121,600 |
| 2021 | $2,597 | $112,700 | $20,000 | $92,700 |
| 2020 | $2,641 | $112,700 | $20,000 | $92,700 |
| 2019 | $2,595 | $112,700 | $20,000 | $92,700 |
| 2018 | $2,256 | $86,600 | $16,700 | $69,900 |
| 2017 | $2,307 | $86,600 | $16,700 | $69,900 |
| 2016 | $2,520 | $86,600 | $16,700 | $69,900 |
| 2015 | $2,312 | $86,600 | $16,700 | $69,900 |
| 2014 | $2,297 | $86,600 | $16,700 | $69,900 |
| 2013 | $2,367 | $86,600 | $16,700 | $69,900 |
Source: Public Records
Map
Nearby Homes