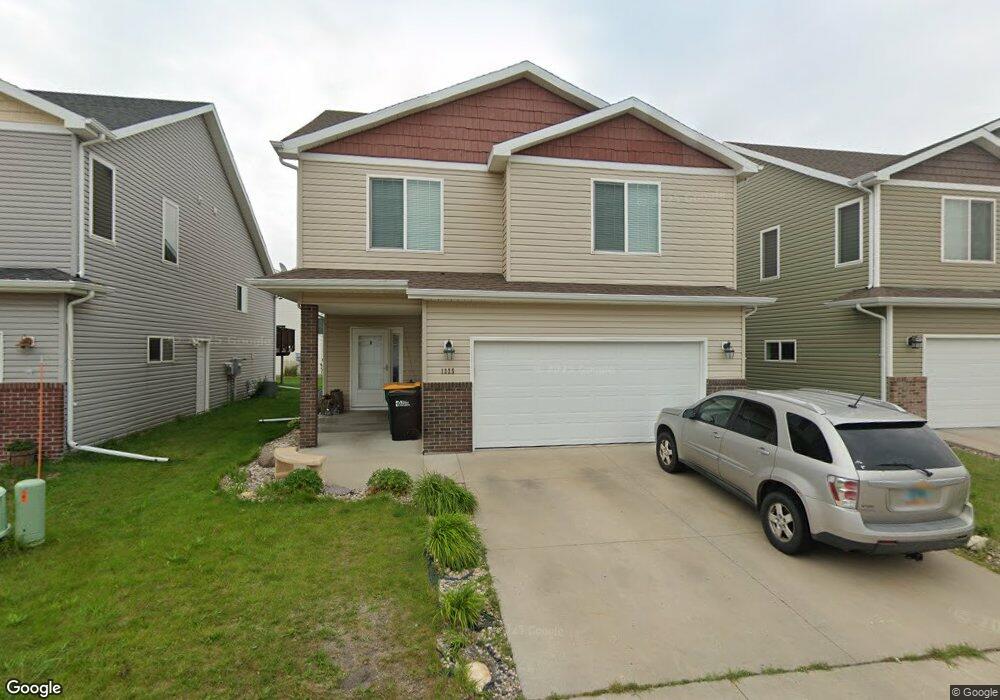
1325 Westport Beach Way West Fargo, ND 58078
Westport Beach NeighborhoodEstimated Value: $290,000 - $308,311
3
Beds
3
Baths
2,000
Sq Ft
$151/Sq Ft
Est. Value
About This Home
This home is located at 1325 Westport Beach Way, West Fargo, ND 58078 and is currently estimated at $301,578, approximately $150 per square foot. 1325 Westport Beach Way is a home located in Cass County with nearby schools including Legacy Elementary School, Liberty Middle School, and West Fargo Sheyenne High School.
Ownership History
Date
Name
Owned For
Owner Type
Purchase Details
Closed on
Jun 29, 2018
Sold by
Senger Sherry
Bought by
Adams Sina R and Adams Aaron O
Current Estimated Value
Home Financials for this Owner
Home Financials are based on the most recent Mortgage that was taken out on this home.
Original Mortgage
$212,555
Outstanding Balance
$185,697
Interest Rate
4.87%
Mortgage Type
FHA
Estimated Equity
$115,881
Purchase Details
Closed on
Dec 22, 2010
Sold by
Senger Sherry Lee and Senger James Allen
Bought by
Senger Sherry Lee
Home Financials for this Owner
Home Financials are based on the most recent Mortgage that was taken out on this home.
Original Mortgage
$125,000
Interest Rate
4.27%
Mortgage Type
New Conventional
Purchase Details
Closed on
Nov 18, 2010
Sold by
Jordahl Custom Homes Inc
Bought by
Senger Sherry
Home Financials for this Owner
Home Financials are based on the most recent Mortgage that was taken out on this home.
Original Mortgage
$125,000
Interest Rate
4.27%
Mortgage Type
New Conventional
Create a Home Valuation Report for This Property
The Home Valuation Report is an in-depth analysis detailing your home's value as well as a comparison with similar homes in the area
Home Values in the Area
Average Home Value in this Area
Purchase History
| Date | Buyer | Sale Price | Title Company |
|---|---|---|---|
| Adams Sina R | $223,700 | Title Co | |
| Senger Sherry Lee | -- | -- | |
| Senger Sherry | -- | -- | |
| Jordahl Custom Homes Inc | -- | -- |
Source: Public Records
Mortgage History
| Date | Status | Borrower | Loan Amount |
|---|---|---|---|
| Open | Adams Sina R | $212,555 | |
| Previous Owner | Senger Sherry | $125,000 |
Source: Public Records
Tax History Compared to Growth
Tax History
| Year | Tax Paid | Tax Assessment Tax Assessment Total Assessment is a certain percentage of the fair market value that is determined by local assessors to be the total taxable value of land and additions on the property. | Land | Improvement |
|---|---|---|---|---|
| 2024 | $4,469 | $141,100 | $19,100 | $122,000 |
| 2023 | $4,388 | $137,400 | $19,100 | $118,300 |
| 2022 | $4,276 | $127,100 | $19,100 | $108,000 |
| 2021 | $4,089 | $119,450 | $14,350 | $105,100 |
| 2020 | $4,006 | $114,500 | $14,350 | $100,150 |
| 2019 | $4,269 | $110,550 | $14,350 | $96,200 |
| 2018 | $4,242 | $112,400 | $14,350 | $98,050 |
| 2017 | $4,160 | $113,400 | $14,350 | $99,050 |
| 2016 | $3,736 | $111,000 | $14,350 | $96,650 |
| 2015 | $3,383 | $90,700 | $5,050 | $85,650 |
| 2014 | $3,327 | $84,750 | $5,050 | $79,700 |
| 2013 | $3,316 | $81,700 | $5,050 | $76,650 |
Source: Public Records
Map
Nearby Homes
- 1381 Westport Beach Way
- 1168 43rd Ave W
- 1236 S Beach Way
- 1156 42nd Ave W Unit A
- 1054 42nd Ave W
- 4509 11th St W
- 4507 Newport Ln
- 1040 39th Ave W
- 909 38 1 2 Ave W
- 4534 Westport Pkwy
- 4717 11th St W
- 4757 11th St W
- 1097 Hickory Ln
- 1089 Hickory Ln
- 1082 Larkin Ln
- 1052 50th Ave W
- 974 50th Ave W
- 3662 N Sedona Ct
- 951 50th Ave W
- 5102 11th St W
- 1317 Westport Beach Way
- 1329 Westport Beach Way
- 1229 S Beach Way
- 1333 Westport Beach Way
- 1313 Westport Beach Way
- 1225 S Beach Way
- 1369 Westport Beach Way
- 1322 Westport Beach Way
- 1326 Westport Beach Way
- 1318 Westport Beach Way
- 1330 Westport Beach Way
- 1373 Westport Beach Way
- 1221 S Beach Way
- 1314 Westport Beach Way
- 1334 Westport
- 1334 Westport Beach Way
- 1310 Westport Beach Way
- 1377 Westport Beach Way
- 1217 S Beach Way
- 1240 S Beach Way