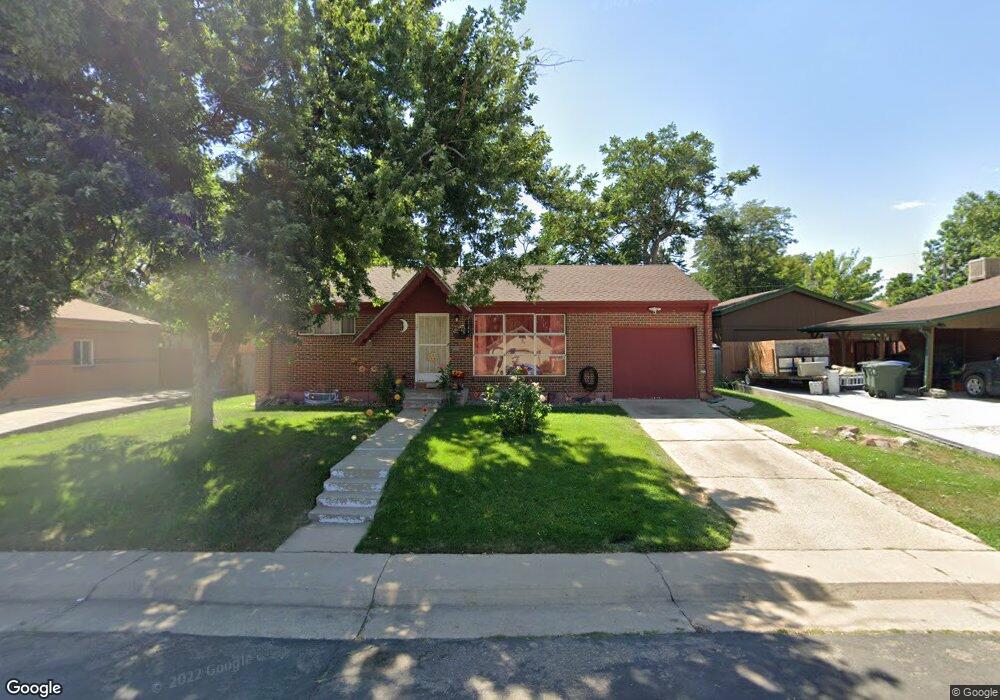
1326 E 108th Place Northglenn, CO 80233
Estimated Value: $379,447 - $444,000
3
Beds
2
Baths
825
Sq Ft
$513/Sq Ft
Est. Value
About This Home
This home is located at 1326 E 108th Place, Northglenn, CO 80233 and is currently estimated at $423,362, approximately $513 per square foot. 1326 E 108th Place is a home located in Adams County with nearby schools including Woodglen Elementary School, Leroy Drive Elementary School, and Northglenn Middle School.
Ownership History
Date
Name
Owned For
Owner Type
Purchase Details
Closed on
Jul 2, 2001
Sold by
Walsh Scott T and Chandler Melissa M
Bought by
Martinez Rodolfo and Martinez Alberto
Current Estimated Value
Home Financials for this Owner
Home Financials are based on the most recent Mortgage that was taken out on this home.
Original Mortgage
$168,568
Interest Rate
7.2%
Mortgage Type
FHA
Purchase Details
Closed on
Jun 30, 1999
Sold by
Beierle Lori S
Bought by
Walsh Scott T and Chandler Melissa M
Home Financials for this Owner
Home Financials are based on the most recent Mortgage that was taken out on this home.
Original Mortgage
$127,200
Interest Rate
7.21%
Purchase Details
Closed on
Dec 15, 1993
Sold by
Zinniel Lori S
Bought by
Beierle Lori S
Home Financials for this Owner
Home Financials are based on the most recent Mortgage that was taken out on this home.
Original Mortgage
$64,787
Interest Rate
7.12%
Mortgage Type
FHA
Create a Home Valuation Report for This Property
The Home Valuation Report is an in-depth analysis detailing your home's value as well as a comparison with similar homes in the area
Home Values in the Area
Average Home Value in this Area
Purchase History
| Date | Buyer | Sale Price | Title Company |
|---|---|---|---|
| Martinez Rodolfo | $170,950 | -- | |
| Walsh Scott T | $126,500 | Heritage Title | |
| Beierle Lori S | -- | -- |
Source: Public Records
Mortgage History
| Date | Status | Borrower | Loan Amount |
|---|---|---|---|
| Closed | Martinez Alberto | $169,814 | |
| Closed | Martinez Rodolfo | $168,568 | |
| Previous Owner | Walsh Scott T | $127,200 | |
| Previous Owner | Beierle Lori S | $64,787 |
Source: Public Records
Tax History Compared to Growth
Tax History
| Year | Tax Paid | Tax Assessment Tax Assessment Total Assessment is a certain percentage of the fair market value that is determined by local assessors to be the total taxable value of land and additions on the property. | Land | Improvement |
|---|---|---|---|---|
| 2024 | $3,053 | $25,880 | $5,750 | $20,130 |
| 2023 | $3,025 | $29,290 | $5,610 | $23,680 |
| 2022 | $3,011 | $23,840 | $5,770 | $18,070 |
| 2021 | $3,107 | $23,840 | $5,770 | $18,070 |
| 2020 | $2,900 | $22,700 | $5,930 | $16,770 |
| 2019 | $2,902 | $22,700 | $5,930 | $16,770 |
| 2018 | $2,239 | $17,070 | $5,400 | $11,670 |
| 2017 | $2,061 | $17,070 | $5,400 | $11,670 |
| 2016 | $1,721 | $13,920 | $3,020 | $10,900 |
| 2015 | $1,718 | $13,920 | $3,020 | $10,900 |
| 2014 | $1,534 | $12,110 | $2,390 | $9,720 |
Source: Public Records
Map
Nearby Homes
- 10761 Rosalie Dr
- 10674 Downing St
- 10966 Alvin Dr
- 1102 Leroy Dr
- 1324 Lucille Ct
- 1462 E 110th Place
- 10429 Lafayette St
- 10752 Blue Jay Ln
- 10440 Gilpin St
- 11009 Gaylord St
- 11045 Gaylord St
- 11062 Gaylord St
- 1803 Graves Ct
- 10448 Pearl Way
- 10440 Pennsylvania St
- 11149 Gaylord St
- 500 E 111th Place
- 11112 Claude Ct
- 11360 Irma Dr
- 10452 Washington Way
- 1346 E 108th Place
- 1306 E 108th Place
- 1365 Regina Ln
- 1345 Regina Ln
- 1366 E 108th Place
- 1375 Regina Ln
- 1266 E 108th Place
- 1347 E 108th Place
- 1325 Regina Ln
- 1307 E 108th Place
- 1367 E 108th Place
- 1246 E 108th Place
- 1405 Regina Ln
- 1406 E 108th Place
- 1305 Regina Ln
- 1267 E 108th Place
- 1344 Regina Ln
- 10894 Larry Dr
- 10890 Larry Dr
- 1407 E 108th Place