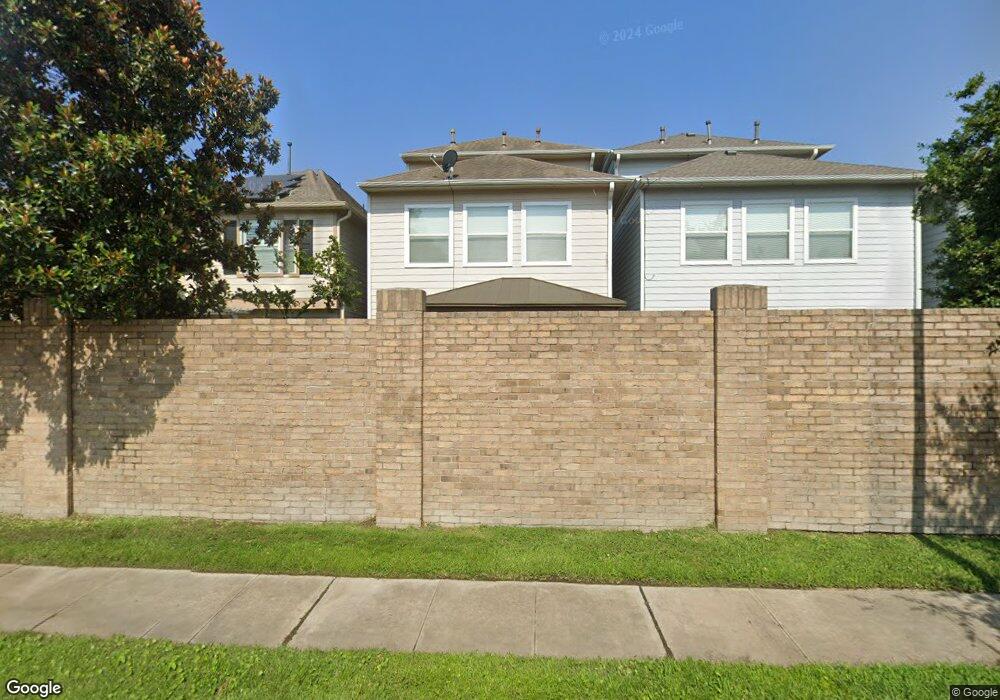
1326 Ella Place Houston, TX 77008
Lazy Brook-Timbergrove NeighborhoodEstimated Value: $529,658 - $602,000
3
Beds
3
Baths
2,930
Sq Ft
$195/Sq Ft
Est. Value
About This Home
This home is located at 1326 Ella Place, Houston, TX 77008 and is currently estimated at $571,415, approximately $195 per square foot. 1326 Ella Place is a home located in Harris County with nearby schools including Sinclair Elementary School, Frank Black Middle School, and Waltrip High School.
Ownership History
Date
Name
Owned For
Owner Type
Purchase Details
Closed on
Sep 18, 2012
Sold by
Tras Mimi P
Bought by
Pham Mimi P
Current Estimated Value
Home Financials for this Owner
Home Financials are based on the most recent Mortgage that was taken out on this home.
Original Mortgage
$192,000
Outstanding Balance
$32,068
Interest Rate
3.66%
Mortgage Type
New Conventional
Estimated Equity
$539,347
Purchase Details
Closed on
Jun 9, 2010
Sold by
Tran Mimi P and Candelaria Michael
Bought by
Tran Mimi P
Purchase Details
Closed on
Feb 15, 2008
Sold by
Roc Homes Texas Ltd
Bought by
Tran Mimi P and Candelaria Michael
Home Financials for this Owner
Home Financials are based on the most recent Mortgage that was taken out on this home.
Original Mortgage
$254,915
Interest Rate
6.07%
Mortgage Type
Purchase Money Mortgage
Create a Home Valuation Report for This Property
The Home Valuation Report is an in-depth analysis detailing your home's value as well as a comparison with similar homes in the area
Home Values in the Area
Average Home Value in this Area
Purchase History
| Date | Buyer | Sale Price | Title Company |
|---|---|---|---|
| Pham Mimi P | -- | Chicago Title | |
| Tran Mimi P | -- | Landtitle Usa Inc | |
| Tran Mimi P | -- | Texas American Title Company |
Source: Public Records
Mortgage History
| Date | Status | Borrower | Loan Amount |
|---|---|---|---|
| Open | Pham Mimi P | $192,000 | |
| Previous Owner | Tran Mimi P | $254,915 |
Source: Public Records
Tax History Compared to Growth
Tax History
| Year | Tax Paid | Tax Assessment Tax Assessment Total Assessment is a certain percentage of the fair market value that is determined by local assessors to be the total taxable value of land and additions on the property. | Land | Improvement |
|---|---|---|---|---|
| 2025 | $7,490 | $539,328 | $155,430 | $383,898 |
| 2024 | $7,490 | $539,328 | $155,430 | $383,898 |
| 2023 | $7,490 | $471,067 | $155,430 | $315,637 |
| 2022 | $9,071 | $439,472 | $103,620 | $335,852 |
| 2021 | $8,729 | $374,511 | $103,620 | $270,891 |
| 2020 | $9,154 | $378,000 | $103,620 | $274,380 |
| 2019 | $9,565 | $378,000 | $103,620 | $274,380 |
| 2018 | $7,388 | $378,000 | $103,620 | $274,380 |
| 2017 | $9,558 | $378,000 | $103,620 | $274,380 |
| 2016 | $10,296 | $407,205 | $88,077 | $319,128 |
| 2015 | $6,950 | $407,205 | $88,077 | $319,128 |
| 2014 | $6,950 | $360,259 | $77,715 | $282,544 |
Source: Public Records
Map
Nearby Homes
- 3106 Heritage Creek Oaks
- 3130 Heritage Creek Terrace
- 6335 Waltway Dr
- 6322 Wynnwood Ln
- 6423 Pineshade Ln
- 1406 Foxwood Rd
- 6518 Kury Ln
- 3402 Timbergrove Heights St
- 1506 Foxwood Rd
- 3411 Timbergrove Heights St
- 6227 Grovewood Ln
- 1606 Tannehill Dr
- 1723 Tannehill Dr
- 1814 Haverhill Dr
- 1607 Haverhill Dr
- 1607 Willowby Dr
- 1003 Golden Nectar Ln
- 3303 Green Daisy Ln
- 3302 Green Nook Ln
- 1114 Pearlwood Dr
- 1322 Ella Place
- 1330 Ella Place
- 1318 Ella Place
- 1334 Ella Place
- 1314 Ella Place
- 1310 Ella Place
- 6507 Azalea Park
- 6511 Azalea Park
- 6515 Azalea Park
- 6519 Azalea Park
- 1306 Ella Place
- 1323 Ella Place
- 1 Ella Place
- 1319 Ella Place
- 1331 Ella Place
- 1302 Ella Place
- 1315 Ella Place
- 1335 Ella Place
- 1311 Ella Place
- 1307 Ella Place