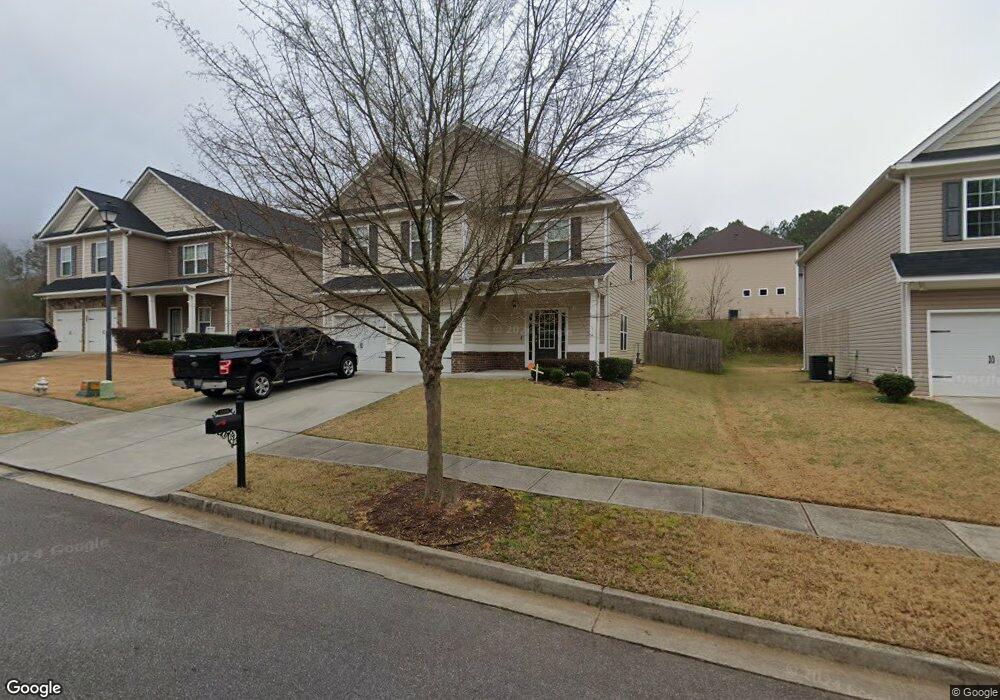
1326 Key Manor Ln Unit 17 Lawrenceville, GA 30045
Estimated Value: $390,000 - $440,000
4
Beds
3
Baths
2,252
Sq Ft
$183/Sq Ft
Est. Value
About This Home
This home is located at 1326 Key Manor Ln Unit 17, Lawrenceville, GA 30045 and is currently estimated at $412,518, approximately $183 per square foot. 1326 Key Manor Ln Unit 17 is a home located in Gwinnett County with nearby schools including Alcova Elementary School, Dacula Middle School, and Dacula High School.
Ownership History
Date
Name
Owned For
Owner Type
Purchase Details
Closed on
Feb 15, 2023
Sold by
Gonzalez Javier Vinasco
Bought by
Beltran Luis Salvador Barrio and Salazar Elsa Cecilia
Current Estimated Value
Home Financials for this Owner
Home Financials are based on the most recent Mortgage that was taken out on this home.
Original Mortgage
$387,030
Outstanding Balance
$374,487
Interest Rate
6.15%
Mortgage Type
New Conventional
Estimated Equity
$38,031
Purchase Details
Closed on
Apr 16, 2014
Sold by
Sdc Gwinnett Llc
Bought by
Gonzalez Javier Vinasco
Home Financials for this Owner
Home Financials are based on the most recent Mortgage that was taken out on this home.
Original Mortgage
$158,284
Interest Rate
4.75%
Mortgage Type
FHA
Purchase Details
Closed on
Dec 13, 2013
Sold by
Reo Funding Solutions Ii L
Bought by
Highland Falls Llc
Create a Home Valuation Report for This Property
The Home Valuation Report is an in-depth analysis detailing your home's value as well as a comparison with similar homes in the area
Home Values in the Area
Average Home Value in this Area
Purchase History
| Date | Buyer | Sale Price | Title Company |
|---|---|---|---|
| Beltran Luis Salvador Barrio | $399,000 | -- | |
| Gonzalez Javier Vinasco | $161,205 | -- | |
| Highland Falls Llc | $144,000 | -- |
Source: Public Records
Mortgage History
| Date | Status | Borrower | Loan Amount |
|---|---|---|---|
| Open | Beltran Luis Salvador Barrio | $387,030 | |
| Previous Owner | Gonzalez Javier Vinasco | $158,284 |
Source: Public Records
Tax History Compared to Growth
Tax History
| Year | Tax Paid | Tax Assessment Tax Assessment Total Assessment is a certain percentage of the fair market value that is determined by local assessors to be the total taxable value of land and additions on the property. | Land | Improvement |
|---|---|---|---|---|
| 2024 | $5,795 | $159,600 | $32,000 | $127,600 |
| 2023 | $5,795 | $172,760 | $32,000 | $140,760 |
| 2022 | $4,242 | $154,040 | $27,600 | $126,440 |
| 2021 | $3,533 | $116,880 | $20,800 | $96,080 |
| 2020 | $3,402 | $109,600 | $18,400 | $91,200 |
| 2019 | $3,153 | $101,840 | $18,400 | $83,440 |
| 2018 | $2,936 | $91,720 | $16,360 | $75,360 |
| 2016 | $2,439 | $68,400 | $13,600 | $54,800 |
| 2015 | $2,377 | $64,480 | $9,600 | $54,880 |
| 2014 | $373 | $3,200 | $3,200 | $0 |
Source: Public Records
Map
Nearby Homes
- 1241 Key Manor Ln
- 1250 Image Ives Dr
- 85 Brushed Ives Ct
- 1520 Cedars Rd
- 1317 Image Crossing
- 1190 Mercury Dr Unit 1
- 1506 Charcoal Ives Rd
- 1509 Charcoal Ives Rd
- 68 Hardy Water Dr
- 0 Billy McGee Rd SE Unit 7656196
- 0 Billy McGee Rd SE Unit 10613215
- 2149 Charcoal Ives Rd
- 1431 Brushed Ln
- 1739 Charcoal Ives Rd
- 20 Bacchus Dr
- 127 Charcoal Ives Dr
- 153 Fern Walk
- 1522 Alcovy Falls Dr
- 72 Fern Walk
- 1326 Key Manor Ln
- 1336 Key Manor Ln
- 1316 Key Manor Ln
- 54 Key Dr SE
- 0 Key Dr Unit 8379716
- 0 Key Dr
- 0 Lock Key Dr Unit 7334309
- 0 Lock Key Dr
- 49 Lock Key Dr
- 44 Key Dr
- 59 Lock Key Dr
- 1311 Key Manor Ln
- 1 Key Dr
- 1296 Key Manor Ln
- 63 Key Dr
- 1301 Key Manor Ln
- 1341 Key Manor Ln
- 53 Key Dr
- 39 Lock Key Dr
- 0 Key Manor Ln Unit 7461587