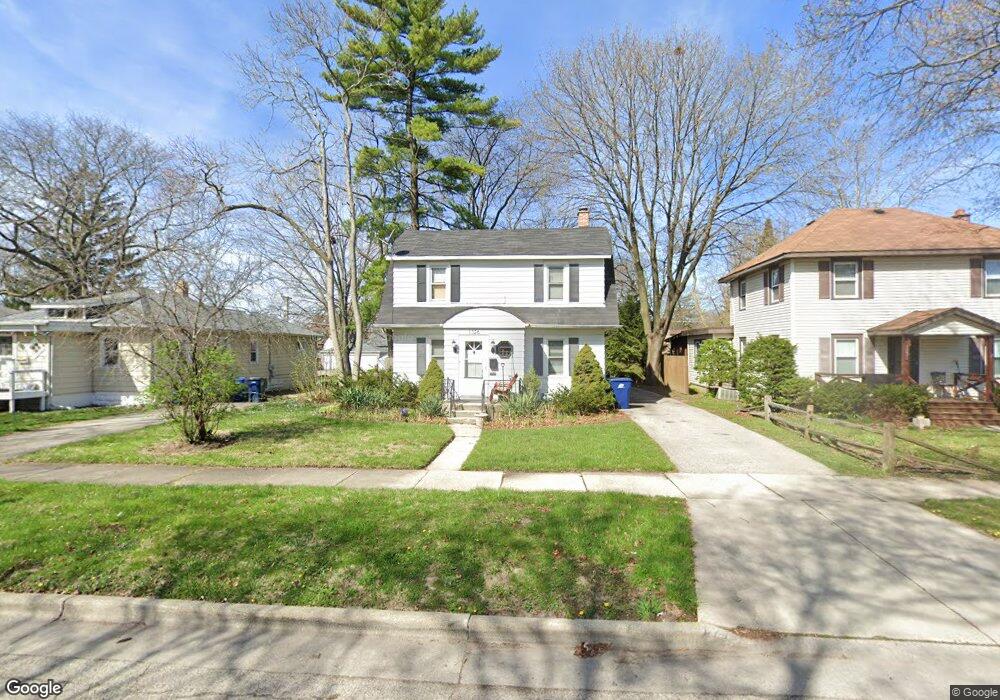
1326 N Ash St Waukegan, IL 60085
Estimated Value: $230,906 - $256,000
3
Beds
1
Bath
1,242
Sq Ft
$197/Sq Ft
Est. Value
About This Home
This home is located at 1326 N Ash St, Waukegan, IL 60085 and is currently estimated at $245,227, approximately $197 per square foot. 1326 N Ash St is a home located in Lake County with nearby schools including Glen Flora Elementary School, Edith M Smith Middle School, and Waukegan High School.
Ownership History
Date
Name
Owned For
Owner Type
Purchase Details
Closed on
Sep 10, 2015
Sold by
Lobue David J and Lobue David
Bought by
The Lobue Family Trust
Current Estimated Value
Purchase Details
Closed on
Sep 23, 2010
Sold by
Federal Home Loan Mortgage Corporation
Bought by
Lobue David J
Purchase Details
Closed on
Mar 4, 2010
Sold by
Whisler Michael W
Bought by
Federal Home Loan Mortgage Corp
Purchase Details
Closed on
May 6, 2002
Sold by
Reynolds Richard L and Reynolds Marilyn E
Bought by
Whisler Michael W and Whisler Antoinette M
Home Financials for this Owner
Home Financials are based on the most recent Mortgage that was taken out on this home.
Original Mortgage
$116,928
Interest Rate
7%
Mortgage Type
FHA
Create a Home Valuation Report for This Property
The Home Valuation Report is an in-depth analysis detailing your home's value as well as a comparison with similar homes in the area
Home Values in the Area
Average Home Value in this Area
Purchase History
| Date | Buyer | Sale Price | Title Company |
|---|---|---|---|
| The Lobue Family Trust | -- | Attorney | |
| Lobue David J | $55,000 | None Available | |
| Federal Home Loan Mortgage Corp | -- | None Available | |
| Whisler Michael W | $118,000 | -- |
Source: Public Records
Mortgage History
| Date | Status | Borrower | Loan Amount |
|---|---|---|---|
| Previous Owner | Whisler Michael W | $116,928 |
Source: Public Records
Tax History Compared to Growth
Tax History
| Year | Tax Paid | Tax Assessment Tax Assessment Total Assessment is a certain percentage of the fair market value that is determined by local assessors to be the total taxable value of land and additions on the property. | Land | Improvement |
|---|---|---|---|---|
| 2024 | $4,961 | $58,333 | $10,899 | $47,434 |
| 2023 | $4,553 | $52,608 | $9,829 | $42,779 |
| 2022 | $4,553 | $46,568 | $9,145 | $37,423 |
| 2021 | $4,337 | $41,599 | $8,158 | $33,441 |
| 2020 | $4,393 | $38,754 | $7,600 | $31,154 |
| 2019 | $4,421 | $35,512 | $6,964 | $28,548 |
| 2018 | $4,380 | $33,876 | $9,856 | $24,020 |
| 2017 | $4,263 | $29,971 | $8,720 | $21,251 |
| 2016 | $3,731 | $24,142 | $7,578 | $16,564 |
| 2015 | $3,650 | $21,607 | $6,782 | $14,825 |
| 2014 | $3,384 | $20,003 | $6,897 | $13,106 |
| 2012 | $3,142 | $21,672 | $7,472 | $14,200 |
Source: Public Records
Map
Nearby Homes
- 1336 N Ash St
- 1335 Chestnut St
- 1110 N Ash St
- 1312 N Linden Ave
- 616 W Keith Ave
- 1105 Woodlawn Cir
- 1018 W Atlantic Ave
- 918 N Ash St
- 415 W Ridgeland Ave
- 917 N Linden Ave
- 1000 Pine St
- 1504 W Glen Flora Ave
- 1109 Massena Ave
- 1905 Linden Ave
- 620 N Poplar St
- 1117 Judge Ave
- 824 N Butrick St
- 702 Franklin St
- 723 N County St
- 325 4th St
- 1332 N Ash St
- 1334 N Ash St
- 1316 N Ash St
- 1314 N Ash St
- 1325 Chestnut St
- 1327 Chestnut St
- 1321 Chestnut St
- 1331 Chestnut St
- 1319 Chestnut St
- 1342 N Ash St
- 1317 Chestnut St
- 1323 N Ash St
- 1331 N Ash St Unit 2
- 1331 N Ash St Unit 1
- 1327 N Ash St
- 1319 N Ash St
- 717 W Grove Ave
- 1315 N Ash St
- 1344 N Ash St
- 1311 Chestnut St