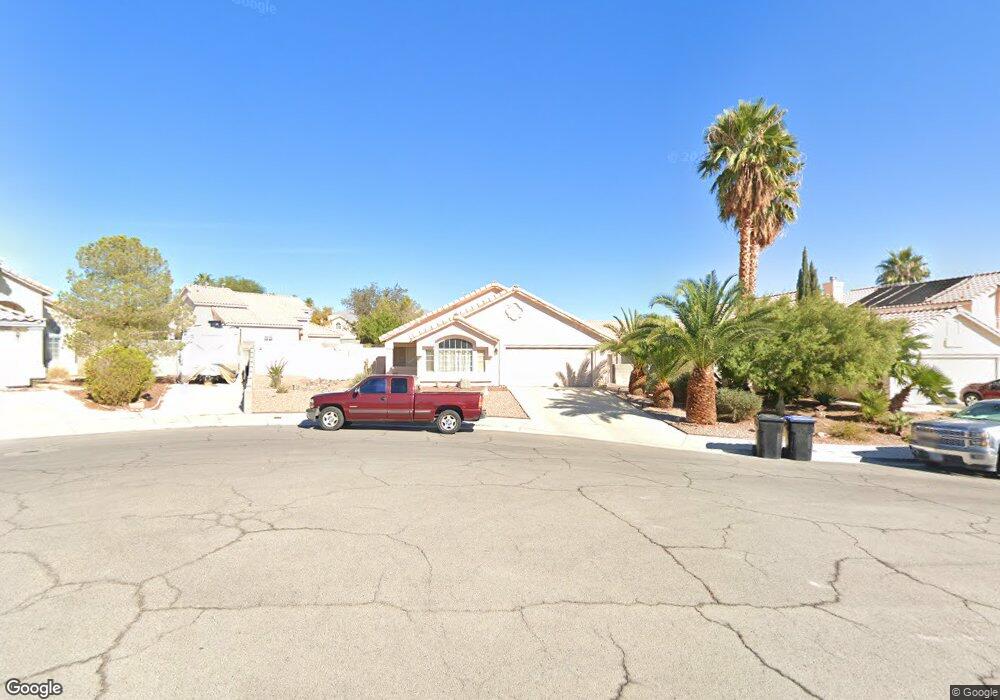
1326 Red Torador Cir North Las Vegas, NV 89031
Craig Ranch NeighborhoodEstimated Value: $354,000 - $390,000
2
Beds
2
Baths
1,248
Sq Ft
$297/Sq Ft
Est. Value
About This Home
This home is located at 1326 Red Torador Cir, North Las Vegas, NV 89031 and is currently estimated at $370,549, approximately $296 per square foot. 1326 Red Torador Cir is a home located in Clark County with nearby schools including Eva Wolfe Elementary School, Addeliar Guy Elementary School, and Theron L Swainston Middle School.
Ownership History
Date
Name
Owned For
Owner Type
Purchase Details
Closed on
Nov 25, 2009
Sold by
Zanazanian Dawn M and Zanazanian Kevork I
Bought by
Zanazanian Kevork I and Zanazanian Dawn M
Current Estimated Value
Home Financials for this Owner
Home Financials are based on the most recent Mortgage that was taken out on this home.
Original Mortgage
$87,387
Outstanding Balance
$56,940
Interest Rate
4.88%
Mortgage Type
FHA
Estimated Equity
$313,609
Purchase Details
Closed on
Jul 21, 2006
Sold by
Bagwell Dawn M
Bought by
Zanazanian Kevork and Bagwell Dawn M
Purchase Details
Closed on
Apr 26, 1999
Sold by
Wilson Judy L
Bought by
Bagwell Dawn M
Home Financials for this Owner
Home Financials are based on the most recent Mortgage that was taken out on this home.
Original Mortgage
$103,327
Interest Rate
6.98%
Mortgage Type
FHA
Create a Home Valuation Report for This Property
The Home Valuation Report is an in-depth analysis detailing your home's value as well as a comparison with similar homes in the area
Home Values in the Area
Average Home Value in this Area
Purchase History
| Date | Buyer | Sale Price | Title Company |
|---|---|---|---|
| Zanazanian Kevork I | -- | Equity Title Of Nevada | |
| Zanazanian Kevork | -- | Fidelity National Title | |
| Bagwell Dawn M | $104,000 | First American Title Co |
Source: Public Records
Mortgage History
| Date | Status | Borrower | Loan Amount |
|---|---|---|---|
| Open | Zanazanian Kevork I | $87,387 | |
| Closed | Bagwell Dawn M | $103,327 |
Source: Public Records
Tax History Compared to Growth
Tax History
| Year | Tax Paid | Tax Assessment Tax Assessment Total Assessment is a certain percentage of the fair market value that is determined by local assessors to be the total taxable value of land and additions on the property. | Land | Improvement |
|---|---|---|---|---|
| 2025 | $1,021 | $73,931 | $30,450 | $43,481 |
| 2024 | $992 | $73,931 | $30,450 | $43,481 |
| 2023 | $992 | $71,639 | $30,100 | $41,539 |
| 2022 | $963 | $61,974 | $23,800 | $38,174 |
| 2021 | $935 | $59,174 | $22,750 | $36,424 |
| 2020 | $905 | $59,066 | $22,750 | $36,316 |
| 2019 | $878 | $53,404 | $17,500 | $35,904 |
| 2018 | $853 | $48,034 | $13,300 | $34,734 |
| 2017 | $1,630 | $48,607 | $13,300 | $35,307 |
| 2016 | $809 | $42,533 | $9,100 | $33,433 |
| 2015 | $806 | $32,362 | $7,000 | $25,362 |
| 2014 | $783 | $22,633 | $7,000 | $15,633 |
Source: Public Records
Map
Nearby Homes
- 1325 Fiesta Grande Ct
- 5104 Camino Del Santo Pkwy
- 1329 Pine Terrace Ct
- 1537 Ascension Cir
- 5045 Bayberry Crest St
- 5049 Bayberry Crest St
- 1069 Appleblossom Time Ave
- 1132 Turnstone Ct
- 1301 Misty View Ct
- 1640 Mesa Blanca Way
- 4840 High Creek Dr
- 1225 Stonesthrow Cir
- 1213 Stonesthrow Cir
- 1531 Camarillo Dr
- 908 Cypress Gold Ct
- 921 Evening Fawn Dr
- 1826 Monte Alban Dr
- 1038 Solemn Cactus Ave
- 1906 Chavez Ct
- 3601 Allen Creek Ct
- 1322 Red Torador Cir
- 1330 Red Torador Cir
- 1329 Fiesta Grande Ct
- 1318 Red Torador Cir
- 1321 Fiesta Grande Ct
- 1333 Red Torador Cir
- 1317 Fiesta Grande Ct
- 1325 Red Torador Cir
- 1314 Red Torador Cir
- 1321 Red Torador Cir
- 1321 Red Torador Cir
- 1321 Red Torador Cir
- 1333 Fiesta Grande Ct
- 5036 Camino Del Santo Pkwy
- 1329 Red Torador Cir
- 5040 Camino Del Santo Pkwy
- 5032 Camino Del Santo Pkwy
- 5044 Camino Del Santo Pkwy
- 1317 Red Torador Cir
- 1313 Fiesta Grande Ct