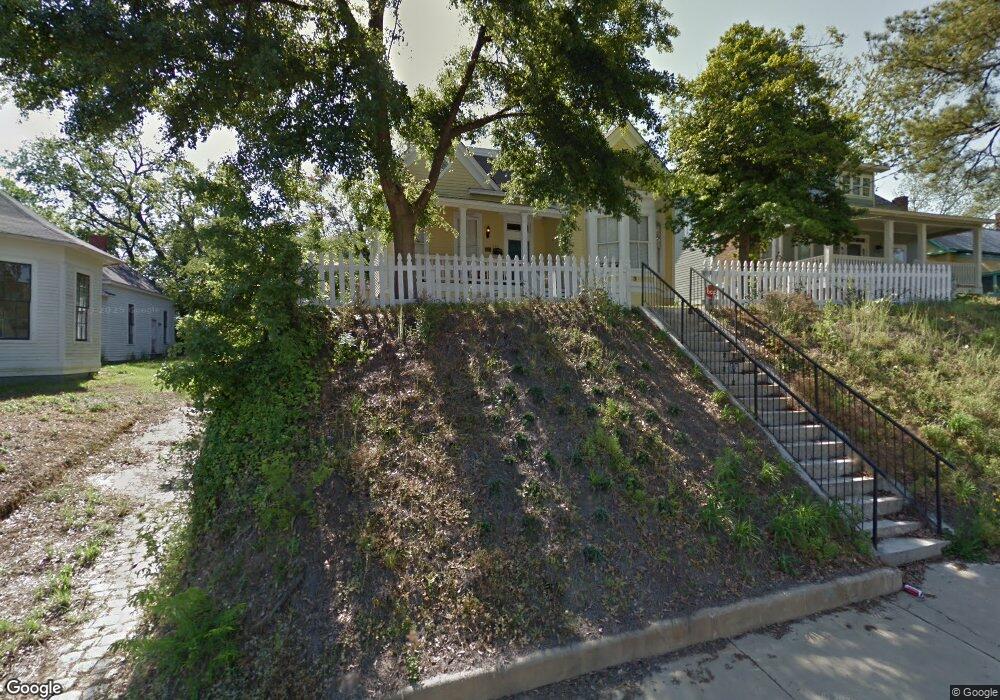
1326 Ross St Macon, GA 31201
Bealls Hill Historic District NeighborhoodEstimated Value: $149,322 - $275,000
2
Beds
2
Baths
1,244
Sq Ft
$163/Sq Ft
Est. Value
About This Home
This home is located at 1326 Ross St, Macon, GA 31201 and is currently estimated at $203,081, approximately $163 per square foot. 1326 Ross St is a home with nearby schools including Ingram-Pye Elementary School, Southwest High School, and St. Joseph's Catholic School.
Ownership History
Date
Name
Owned For
Owner Type
Purchase Details
Closed on
Jun 1, 2011
Sold by
Historic Macon Properties Llc
Bought by
Tambora Larissa A
Current Estimated Value
Purchase Details
Closed on
May 1, 2008
Sold by
Historic Macon Ftdn Inc
Bought by
Historic Macon Properties Llc
Purchase Details
Closed on
Dec 20, 2007
Sold by
The Macon Bibb County Land Bank Authorit
Bought by
Historic Macon Foundation Inc
Purchase Details
Closed on
Nov 20, 2007
Sold by
Hugley Samuel and Hugley Latrenda
Bought by
The Macon Bibb County Land Bank Authorit
Purchase Details
Closed on
Jul 17, 2003
Purchase Details
Closed on
Jul 1, 2003
Purchase Details
Closed on
Jun 19, 2003
Create a Home Valuation Report for This Property
The Home Valuation Report is an in-depth analysis detailing your home's value as well as a comparison with similar homes in the area
Home Values in the Area
Average Home Value in this Area
Purchase History
| Date | Buyer | Sale Price | Title Company |
|---|---|---|---|
| Tambora Larissa A | $127,900 | -- | |
| Historic Macon Properties Llc | -- | -- | |
| Historic Macon Foundation Inc | -- | None Available | |
| The Macon Bibb County Land Bank Authorit | $18,500 | None Available | |
| -- | $16,000 | -- | |
| -- | -- | -- | |
| -- | -- | -- |
Source: Public Records
Tax History Compared to Growth
Tax History
| Year | Tax Paid | Tax Assessment Tax Assessment Total Assessment is a certain percentage of the fair market value that is determined by local assessors to be the total taxable value of land and additions on the property. | Land | Improvement |
|---|---|---|---|---|
| 2025 | $1,558 | $63,412 | $6,600 | $56,812 |
| 2024 | $1,610 | $63,412 | $6,600 | $56,812 |
| 2023 | $1,355 | $53,371 | $6,000 | $47,371 |
| 2022 | $2,329 | $67,257 | $10,800 | $56,457 |
| 2021 | $1,950 | $51,324 | $8,308 | $43,016 |
| 2020 | $1,993 | $51,324 | $8,308 | $43,016 |
| 2019 | $2,009 | $51,324 | $8,308 | $43,016 |
| 2018 | $3,257 | $51,324 | $8,308 | $43,016 |
| 2017 | $1,847 | $49,287 | $8,308 | $40,979 |
| 2016 | $1,019 | $49,287 | $8,308 | $40,979 |
| 2015 | $472 | $49,058 | $8,308 | $40,750 |
| 2014 | $543 | $49,058 | $8,308 | $40,750 |
Source: Public Records
Map
Nearby Homes