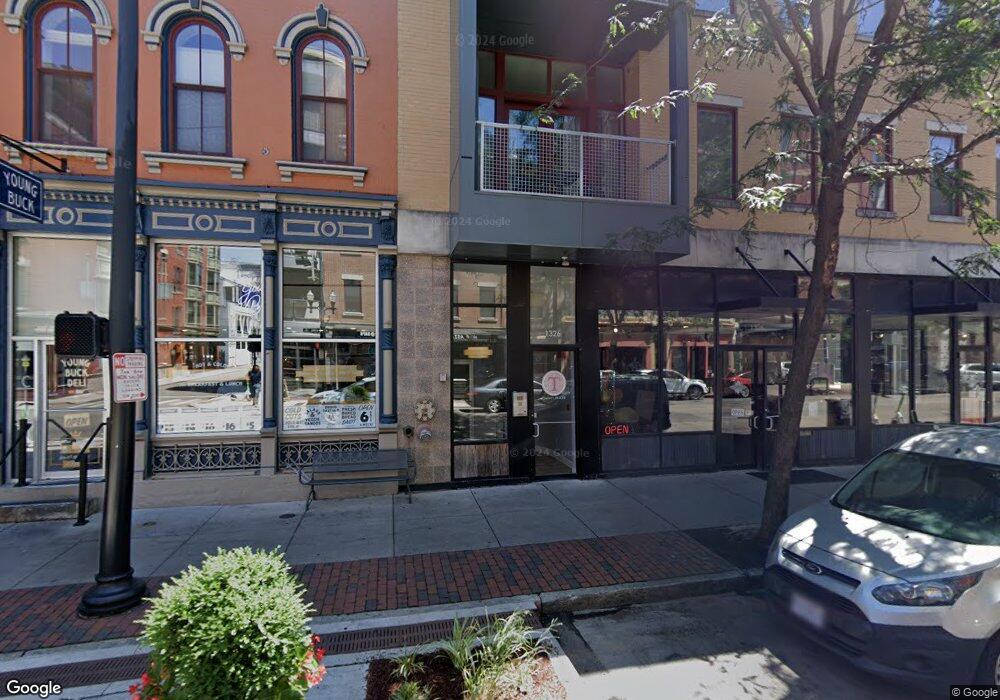
1326 Vine St Cincinnati, OH 45202
Over-The-Rhine NeighborhoodEstimated Value: $286,093 - $357,000
1
Bed
1
Bath
958
Sq Ft
$332/Sq Ft
Est. Value
About This Home
This home is located at 1326 Vine St, Cincinnati, OH 45202 and is currently estimated at $317,773, approximately $331 per square foot. 1326 Vine St is a home located in Hamilton County with nearby schools including Rothenberg Preparatory Academy, Robert A. Taft Information Technology High School, and Western Hills High School.
Ownership History
Date
Name
Owned For
Owner Type
Purchase Details
Closed on
Jun 28, 2022
Sold by
Hodapp Justin D and Hodapp Chelsea R
Bought by
Cioffi Susie
Current Estimated Value
Home Financials for this Owner
Home Financials are based on the most recent Mortgage that was taken out on this home.
Original Mortgage
$98,148
Outstanding Balance
$88,436
Interest Rate
5.1%
Mortgage Type
New Conventional
Estimated Equity
$229,337
Purchase Details
Closed on
Apr 20, 2018
Sold by
Frak Tari
Bought by
Hodapp Justin D and Hodapp Chelsea R
Home Financials for this Owner
Home Financials are based on the most recent Mortgage that was taken out on this home.
Original Mortgage
$238,500
Interest Rate
4.44%
Mortgage Type
New Conventional
Purchase Details
Closed on
Jun 30, 2010
Sold by
Trinity Flats Llc
Bought by
Frank Tari
Home Financials for this Owner
Home Financials are based on the most recent Mortgage that was taken out on this home.
Original Mortgage
$155,317
Interest Rate
4.86%
Mortgage Type
Purchase Money Mortgage
Create a Home Valuation Report for This Property
The Home Valuation Report is an in-depth analysis detailing your home's value as well as a comparison with similar homes in the area
Home Values in the Area
Average Home Value in this Area
Purchase History
| Date | Buyer | Sale Price | Title Company |
|---|---|---|---|
| Cioffi Susie | $265,000 | None Listed On Document | |
| Hodapp Justin D | $265,000 | None Available | |
| Frank Tari | $156,900 | None Available |
Source: Public Records
Mortgage History
| Date | Status | Borrower | Loan Amount |
|---|---|---|---|
| Open | Cioffi Susie | $98,148 | |
| Previous Owner | Hodapp Justin D | $238,500 | |
| Previous Owner | Frank Tari | $155,317 |
Source: Public Records
Tax History Compared to Growth
Tax History
| Year | Tax Paid | Tax Assessment Tax Assessment Total Assessment is a certain percentage of the fair market value that is determined by local assessors to be the total taxable value of land and additions on the property. | Land | Improvement |
|---|---|---|---|---|
| 2024 | $5,751 | $92,750 | $14,700 | $78,050 |
| 2023 | $5,927 | $92,750 | $14,700 | $78,050 |
| 2022 | $6,575 | $92,751 | $10,203 | $82,548 |
| 2021 | $6,302 | $92,751 | $10,203 | $82,548 |
| 2020 | $1,279 | $92,751 | $10,203 | $82,548 |
| 2019 | $926 | $82,831 | $9,625 | $73,206 |
| 2018 | $939 | $82,831 | $9,625 | $73,206 |
| 2017 | $893 | $82,831 | $9,625 | $73,206 |
| 2016 | $1,003 | $60,957 | $10,686 | $50,271 |
| 2015 | $893 | $60,957 | $10,686 | $50,271 |
| 2014 | $900 | $60,957 | $10,686 | $50,271 |
| 2013 | $825 | $54,915 | $9,625 | $45,290 |
Source: Public Records
Map
Nearby Homes
- 1326 Vine St
- 1326 Vine St
- 1326 Vine St
- 1326 Vine St
- 1326 Vine St
- 1326 Vine St
- 1326 Vine St
- 1326 Vine St
- 1326 Vine St
- 1326 Vine St
- 1326 Vine St Unit 17
- 1326 Vine St Unit A
- 1326 Vine St Unit 16
- 1326 Vine St Unit 11
- 1326 Vine St Unit 5
- 1326 Vine St Unit 6
- 1326 Vine St Unit 15
- 1326 Vine St Unit 9
- 1326 Vine St Unit 12
- 1326 Vine St Unit 7