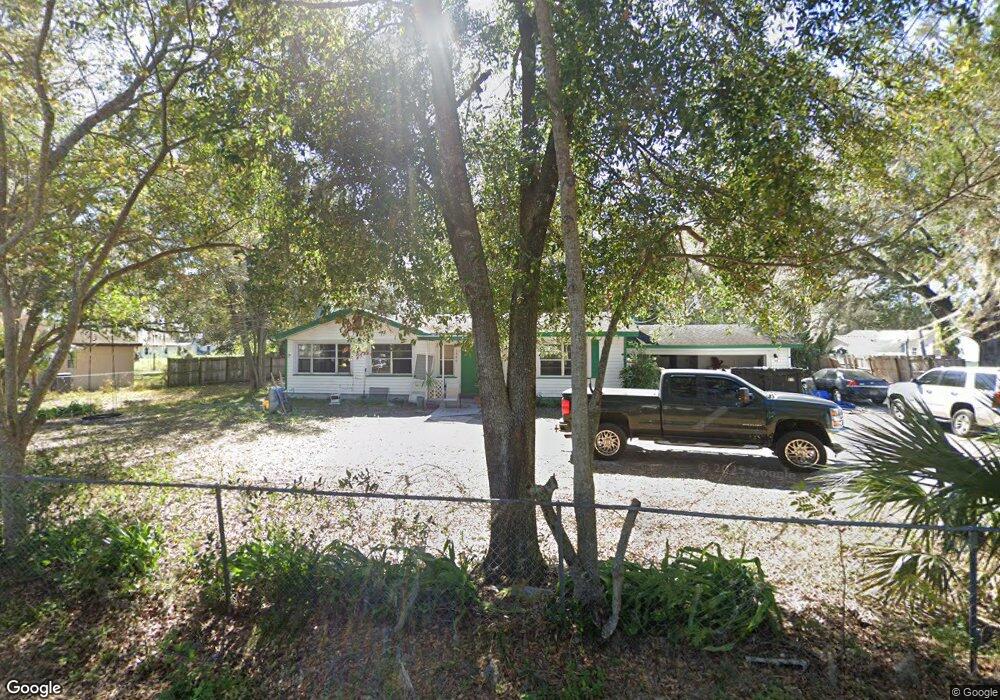
1326 Vine St Daytona Beach, FL 32117
Neighborhood K NeighborhoodEstimated Value: $167,000 - $244,000
3
Beds
1
Bath
1,480
Sq Ft
$137/Sq Ft
Est. Value
About This Home
This home is located at 1326 Vine St, Daytona Beach, FL 32117 and is currently estimated at $202,308, approximately $136 per square foot. 1326 Vine St is a home located in Volusia County with nearby schools including Westside Elementary School, Campbell Middle School, and Mainland High School.
Ownership History
Date
Name
Owned For
Owner Type
Purchase Details
Closed on
Jul 14, 2021
Sold by
Yang
Bought by
Davidson Serenity Rose Marie
Current Estimated Value
Home Financials for this Owner
Home Financials are based on the most recent Mortgage that was taken out on this home.
Original Mortgage
$118,036
Outstanding Balance
$107,099
Interest Rate
2.9%
Mortgage Type
Seller Take Back
Estimated Equity
$95,209
Purchase Details
Closed on
Jan 21, 2011
Sold by
Fannie Mae
Bought by
Yang Yang
Purchase Details
Closed on
Jan 12, 2011
Sold by
Metlife Home Loans
Bought by
Federal National Mortgage Association
Purchase Details
Closed on
Jun 2, 2010
Sold by
United States Of America
Bought by
Metlife Home Loans and Everbank Reverse Mortgage Llc
Purchase Details
Closed on
Dec 29, 2003
Sold by
Murray Sarah Louise
Bought by
Rice Bruce Ellsworth
Home Financials for this Owner
Home Financials are based on the most recent Mortgage that was taken out on this home.
Original Mortgage
$85,000
Interest Rate
6.05%
Create a Home Valuation Report for This Property
The Home Valuation Report is an in-depth analysis detailing your home's value as well as a comparison with similar homes in the area
Home Values in the Area
Average Home Value in this Area
Purchase History
| Date | Buyer | Sale Price | Title Company |
|---|---|---|---|
| Davidson Serenity Rose Marie | $130,000 | Waterside Title Co | |
| Yang Yang | $54,000 | Attorney | |
| Federal National Mortgage Association | -- | None Available | |
| Metlife Home Loans | -- | Attorney | |
| Rice Bruce Ellsworth | $106,500 | -- |
Source: Public Records
Mortgage History
| Date | Status | Borrower | Loan Amount |
|---|---|---|---|
| Open | Davidson Serenity Rose Marie | $118,036 | |
| Previous Owner | Rice Bruce Ellsworth | $85,000 |
Source: Public Records
Tax History Compared to Growth
Tax History
| Year | Tax Paid | Tax Assessment Tax Assessment Total Assessment is a certain percentage of the fair market value that is determined by local assessors to be the total taxable value of land and additions on the property. | Land | Improvement |
|---|---|---|---|---|
| 2025 | $2,916 | $159,887 | $43,710 | $116,177 |
| 2024 | $2,916 | $164,032 | $43,710 | $120,322 |
| 2023 | $2,916 | $143,305 | $36,221 | $107,084 |
| 2022 | $2,810 | $135,594 | $36,221 | $99,373 |
| 2021 | $2,354 | $103,596 | $21,952 | $81,644 |
| 2020 | $2,165 | $94,424 | $16,934 | $77,490 |
| 2019 | $2,048 | $89,432 | $14,515 | $74,917 |
| 2018 | $1,878 | $77,715 | $12,902 | $64,813 |
| 2017 | $1,391 | $60,801 | $10,167 | $50,634 |
| 2016 | $1,237 | $45,187 | $0 | $0 |
| 2015 | $1,313 | $47,016 | $0 | $0 |
| 2014 | $1,301 | $47,009 | $0 | $0 |
Source: Public Records
Map
Nearby Homes
- 1083 Yaupon St
- 1099 Yaupon St
- 1125 Yaupon St
- 945 6th St
- 1257 Dal Maso Dr
- 1367 Vine
- 1137 Yaupon St
- 1082 Yaupon St
- 1372 Blackcherry St
- 1352 Cedar Bluff
- 1209 James Terrace
- 884 E Coquina Dr
- 1180 Dal Maso Dr
- 813 W Colonial Cir
- 0 8th St Unit MFRV4944143
- 0 8th St Unit 1216500
- 888 W Coquina Dr
- 0000 8th St
- 00 8th St
- 1175 Dal Maso Dr