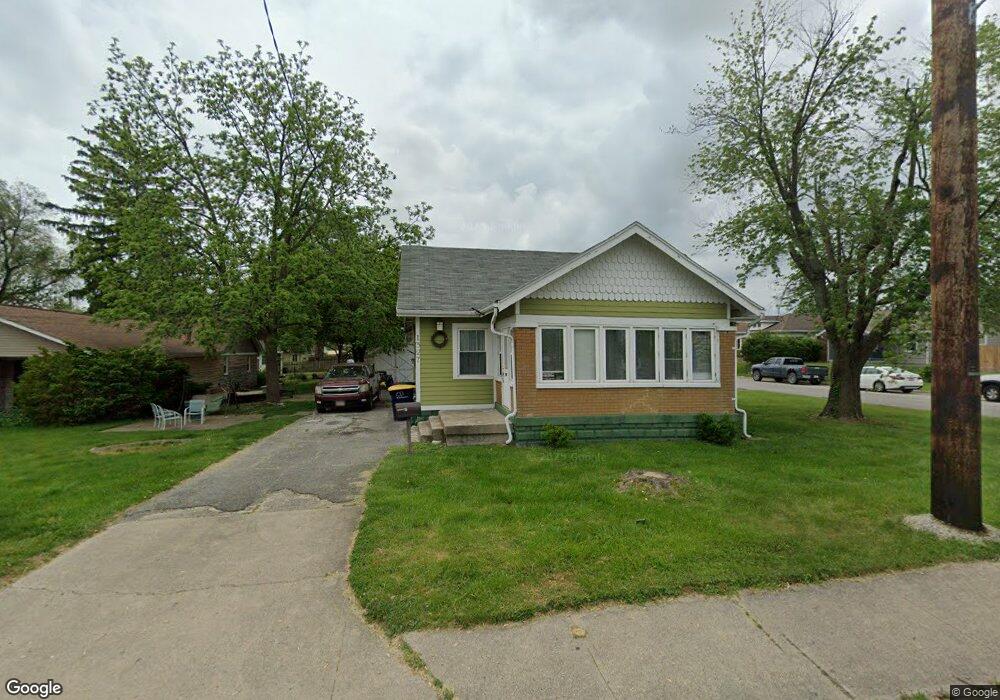
1327 Albany St Beech Grove, IN 46107
Estimated Value: $171,000 - $210,810
2
Beds
2
Baths
1,100
Sq Ft
$173/Sq Ft
Est. Value
About This Home
This home is located at 1327 Albany St, Beech Grove, IN 46107 and is currently estimated at $190,453, approximately $173 per square foot. 1327 Albany St is a home located in Marion County with nearby schools including Hornet Park Elementary School, Central Elementary School, and South Grove Intermediate School.
Ownership History
Date
Name
Owned For
Owner Type
Purchase Details
Closed on
Apr 25, 2006
Sold by
National City Bank Of Indiana
Bought by
Deburger Danny O
Current Estimated Value
Home Financials for this Owner
Home Financials are based on the most recent Mortgage that was taken out on this home.
Original Mortgage
$49,500
Outstanding Balance
$34,483
Interest Rate
10.5%
Mortgage Type
Adjustable Rate Mortgage/ARM
Estimated Equity
$155,970
Purchase Details
Closed on
Oct 3, 2005
Sold by
Hager Norman J and Clayton Amy J
Bought by
National City Bank Of Indiana and National City Bank
Create a Home Valuation Report for This Property
The Home Valuation Report is an in-depth analysis detailing your home's value as well as a comparison with similar homes in the area
Home Values in the Area
Average Home Value in this Area
Purchase History
| Date | Buyer | Sale Price | Title Company |
|---|---|---|---|
| Deburger Danny O | -- | None Available | |
| National City Bank Of Indiana | $65,594 | None Available |
Source: Public Records
Mortgage History
| Date | Status | Borrower | Loan Amount |
|---|---|---|---|
| Open | Deburger Danny O | $49,500 |
Source: Public Records
Tax History Compared to Growth
Tax History
| Year | Tax Paid | Tax Assessment Tax Assessment Total Assessment is a certain percentage of the fair market value that is determined by local assessors to be the total taxable value of land and additions on the property. | Land | Improvement |
|---|---|---|---|---|
| 2024 | $1,468 | $188,000 | $23,400 | $164,600 |
| 2023 | $1,468 | $167,700 | $23,400 | $144,300 |
| 2022 | $1,439 | $155,300 | $23,400 | $131,900 |
| 2021 | $1,411 | $132,200 | $23,400 | $108,800 |
| 2020 | $1,383 | $119,400 | $23,400 | $96,000 |
| 2019 | $1,532 | $119,500 | $13,100 | $106,400 |
| 2018 | $1,267 | $103,400 | $13,100 | $90,300 |
| 2017 | $1,265 | $101,000 | $13,100 | $87,900 |
| 2016 | $1,218 | $98,100 | $13,100 | $85,000 |
| 2014 | $1,042 | $88,100 | $13,100 | $75,000 |
| 2013 | $909 | $78,100 | $13,100 | $65,000 |
Source: Public Records
Map
Nearby Homes