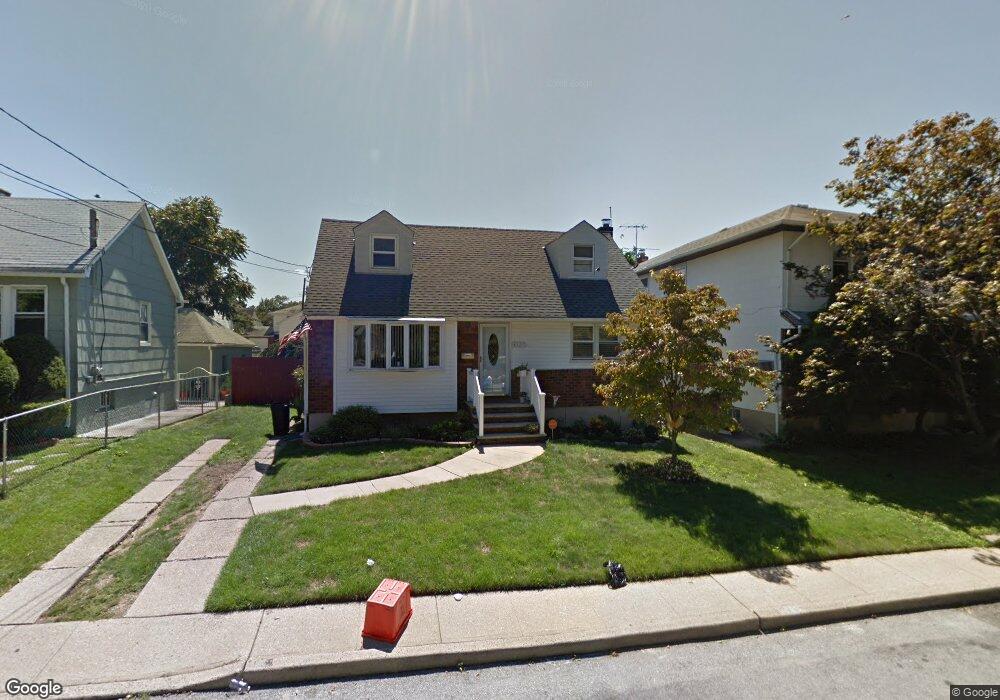
1327 C St Elmont, NY 11003
Estimated Value: $590,099 - $793,000
--
Bed
1
Bath
1,187
Sq Ft
$580/Sq Ft
Est. Value
About This Home
This home is located at 1327 C St, Elmont, NY 11003 and is currently estimated at $688,775, approximately $580 per square foot. 1327 C St is a home located in Nassau County with nearby schools including Cheder at the Ohel.
Ownership History
Date
Name
Owned For
Owner Type
Purchase Details
Closed on
Aug 26, 2021
Sold by
Jeanbon Alexandre and Jeanbon Suzanne
Bought by
Jeanbon Alexandre
Current Estimated Value
Home Financials for this Owner
Home Financials are based on the most recent Mortgage that was taken out on this home.
Original Mortgage
$257,000
Outstanding Balance
$233,851
Interest Rate
2.8%
Mortgage Type
New Conventional
Estimated Equity
$454,924
Purchase Details
Closed on
Sep 13, 2004
Sold by
Jeanbon Alexandre
Purchase Details
Closed on
Jul 22, 1998
Sold by
Bocker Sheila
Bought by
Jeanbon Alexandre
Create a Home Valuation Report for This Property
The Home Valuation Report is an in-depth analysis detailing your home's value as well as a comparison with similar homes in the area
Home Values in the Area
Average Home Value in this Area
Purchase History
| Date | Buyer | Sale Price | Title Company |
|---|---|---|---|
| Jeanbon Alexandre | -- | Stewart Title | |
| -- | -- | -- | |
| Jeanbon Alexandre | $147,000 | -- |
Source: Public Records
Mortgage History
| Date | Status | Borrower | Loan Amount |
|---|---|---|---|
| Open | Jeanbon Alexandre | $257,000 |
Source: Public Records
Tax History Compared to Growth
Tax History
| Year | Tax Paid | Tax Assessment Tax Assessment Total Assessment is a certain percentage of the fair market value that is determined by local assessors to be the total taxable value of land and additions on the property. | Land | Improvement |
|---|---|---|---|---|
| 2025 | $8,933 | $378 | $202 | $176 |
| 2024 | $3,148 | $386 | $206 | $180 |
| 2023 | $7,677 | $386 | $206 | $180 |
| 2022 | $7,677 | $386 | $206 | $180 |
| 2021 | $9,565 | $397 | $212 | $185 |
| 2020 | $7,727 | $498 | $465 | $33 |
| 2019 | $2,879 | $534 | $498 | $36 |
| 2017 | $4,235 | $567 | $433 | $134 |
| 2016 | $7,017 | $693 | $529 | $164 |
| 2015 | $3,158 | $693 | $529 | $164 |
| 2014 | $3,158 | $693 | $529 | $164 |
| 2013 | $2,961 | $693 | $529 | $164 |
Source: Public Records
Map
Nearby Homes