Estimated Value: $509,000 - $534,000
3
Beds
3
Baths
1,900
Sq Ft
$274/Sq Ft
Est. Value
About This Home
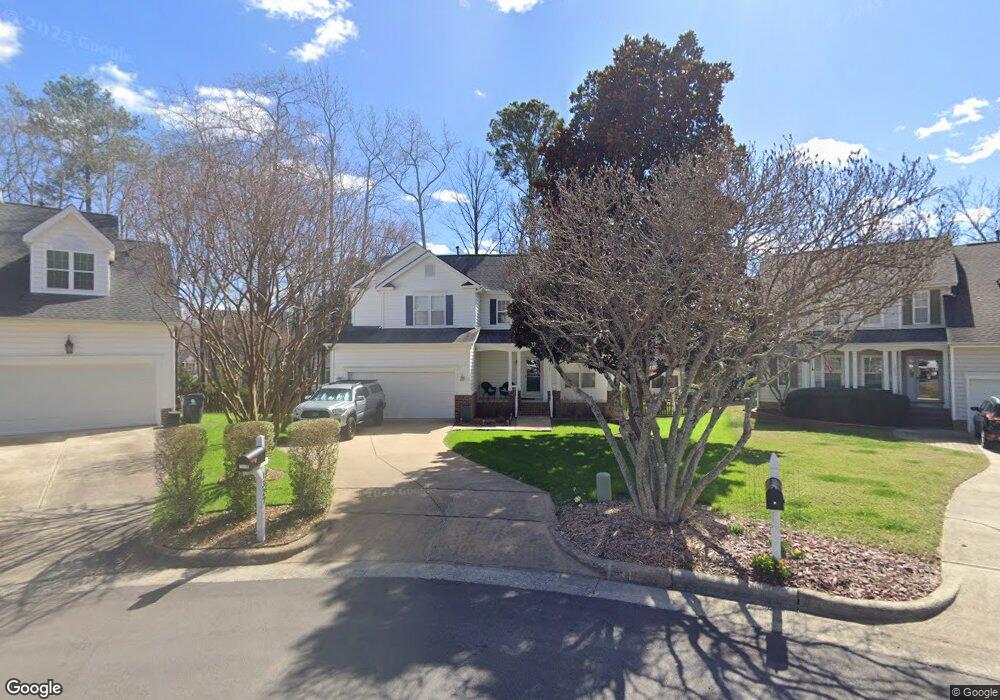
This home is located at 1327 Red Twig Rd, Apex, NC 27502 and is currently estimated at $520,665, approximately $274 per square foot. 1327 Red Twig Rd is a home located in Wake County with nearby schools including Scotts Ridge Elementary School, Apex Middle, and Apex High School.
Ownership History
Date
Name
Owned For
Owner Type
Purchase Details
Closed on
Jun 18, 2010
Sold by
Weiss Jonathan C
Bought by
Fetner Aaron Heath
Current Estimated Value
Home Financials for this Owner
Home Financials are based on the most recent Mortgage that was taken out on this home.
Original Mortgage
$200,000
Outstanding Balance
$134,040
Interest Rate
4.97%
Mortgage Type
New Conventional
Estimated Equity
$386,625
Purchase Details
Closed on
Oct 24, 2005
Sold by
Reedus Jeanne L
Bought by
Weiss Jonathan C and Doyle Shelia M
Home Financials for this Owner
Home Financials are based on the most recent Mortgage that was taken out on this home.
Original Mortgage
$168,000
Interest Rate
5.66%
Mortgage Type
Fannie Mae Freddie Mac
Create a Home Valuation Report for This Property
The Home Valuation Report is an in-depth analysis detailing your home's value as well as a comparison with similar homes in the area
Home Values in the Area
Average Home Value in this Area
Purchase History
| Date | Buyer | Sale Price | Title Company |
|---|---|---|---|
| Fetner Aaron Heath | $227,000 | None Available | |
| Weiss Jonathan C | $210,000 | None Available |
Source: Public Records
Mortgage History
| Date | Status | Borrower | Loan Amount |
|---|---|---|---|
| Open | Fetner Aaron Heath | $200,000 | |
| Previous Owner | Weiss Jonathan C | $168,000 |
Source: Public Records
Tax History Compared to Growth
Tax History
| Year | Tax Paid | Tax Assessment Tax Assessment Total Assessment is a certain percentage of the fair market value that is determined by local assessors to be the total taxable value of land and additions on the property. | Land | Improvement |
|---|---|---|---|---|
| 2025 | $4,385 | $499,932 | $190,000 | $309,932 |
| 2024 | $4,287 | $499,932 | $190,000 | $309,932 |
| 2023 | $3,549 | $321,674 | $68,000 | $253,674 |
| 2022 | $3,332 | $321,674 | $68,000 | $253,674 |
| 2021 | $3,205 | $321,674 | $68,000 | $253,674 |
| 2020 | $3,172 | $321,674 | $68,000 | $253,674 |
| 2019 | $3,038 | $265,773 | $68,000 | $197,773 |
| 2018 | $2,862 | $265,773 | $68,000 | $197,773 |
| 2017 | $2,664 | $265,773 | $68,000 | $197,773 |
| 2016 | $2,626 | $265,773 | $68,000 | $197,773 |
| 2015 | $2,516 | $248,484 | $68,000 | $180,484 |
| 2014 | $2,425 | $248,484 | $68,000 | $180,484 |
Source: Public Records
Map
Nearby Homes
- 1311 Pendula Path
- 3014 Silky Dogwood Trail
- 2008 Silky Dogwood Trail
- 1116 Silky Dogwood Trail
- 1706 Patterson Grove Rd
- 1208 Tartarian Trail
- 1004 Wild Sonnet Ct
- 1105 Capitata Crossing
- 402 Village Loop Dr
- 1002 Tribble Gate Ct
- 104 Pine Tag Ct
- 2113 Barrier Ridge Way Unit Lot 26
- 2117 Barrier Ridge Way Unit Lot 24
- 2112 Barrier Ridge Way Unit Lot 34
- 2120 Barrier Ridge Way Unit Lot 36
- 541 Village Loop Dr
- 2124 Barrier Ridge Way
- 2118 Barrier Ridge Way Unit Lot 35
- 2122 Barrier Ridge Way Unit Lot 37
- 1127 Palisade Bluff Ln
- 1325 Red Twig Rd
- 1329 Red Twig Rd
- 1322 Pendula Path
- 1318 Pendula Path
- 1324 Pendula Path
- 1328 Red Twig Rd
- 1323 Red Twig Rd
- 1316 Pendula Path
- 1326 Pendula Path
- 1326 Red Twig Rd
- 1321 Red Twig Rd
- 1314 Pendula Path
- 1324 Red Twig Rd
- 1328 Pendula Path
- 1322 Red Twig Rd
- 1302 Goldspot Ct
- 1319 Red Twig Rd
- 1406 Patterson Grove Rd
- 1404 Patterson Grove Rd
- 1321 Pendula Path