Estimated Value: $225,000 - $272,000
3
Beds
2
Baths
2,016
Sq Ft
$120/Sq Ft
Est. Value
About This Home
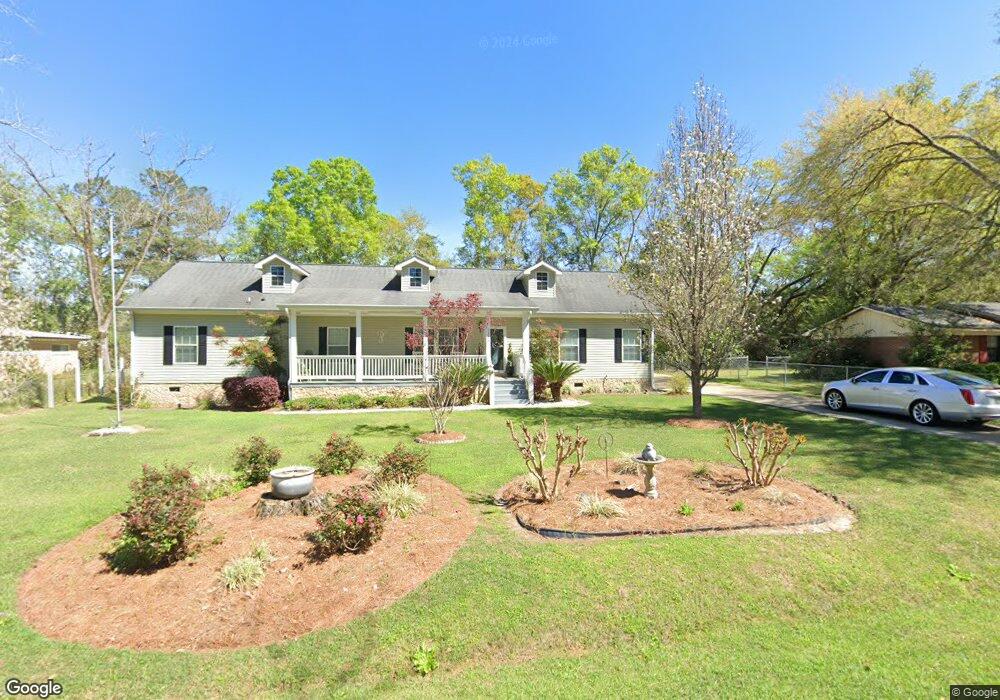
This home is located at 1327 Rest St SW, Cairo, GA 39828 and is currently estimated at $241,794, approximately $119 per square foot. 1327 Rest St SW is a home located in Grady County with nearby schools including Cairo High School.
Ownership History
Date
Name
Owned For
Owner Type
Purchase Details
Closed on
Jun 12, 2008
Sold by
Housing Solutions & Develo
Bought by
Powell Arthur
Current Estimated Value
Home Financials for this Owner
Home Financials are based on the most recent Mortgage that was taken out on this home.
Original Mortgage
$177,420
Outstanding Balance
$113,383
Interest Rate
5.97%
Mortgage Type
New Conventional
Estimated Equity
$128,411
Purchase Details
Closed on
Nov 15, 2007
Sold by
Jones Jackson E
Bought by
Housing Solutions & Developmen
Home Financials for this Owner
Home Financials are based on the most recent Mortgage that was taken out on this home.
Original Mortgage
$22,400
Interest Rate
6.36%
Mortgage Type
New Conventional
Purchase Details
Closed on
Sep 12, 2002
Sold by
Fleetwood Lois H
Bought by
Fleetwood Lois H
Purchase Details
Closed on
Nov 8, 1982
Bought by
Fleetwood Lois H
Create a Home Valuation Report for This Property
The Home Valuation Report is an in-depth analysis detailing your home's value as well as a comparison with similar homes in the area
Home Values in the Area
Average Home Value in this Area
Purchase History
| Date | Buyer | Sale Price | Title Company |
|---|---|---|---|
| Powell Arthur | $23,576 | -- | |
| Housing Solutions & Developmen | $20,000 | -- | |
| Fleetwood Lois H | $3,500 | -- | |
| Fleetwood Lois H | $3,500 | -- |
Source: Public Records
Mortgage History
| Date | Status | Borrower | Loan Amount |
|---|---|---|---|
| Open | Powell Arthur | $177,420 | |
| Previous Owner | Housing Solutions & Developmen | $22,400 |
Source: Public Records
Tax History Compared to Growth
Tax History
| Year | Tax Paid | Tax Assessment Tax Assessment Total Assessment is a certain percentage of the fair market value that is determined by local assessors to be the total taxable value of land and additions on the property. | Land | Improvement |
|---|---|---|---|---|
| 2024 | $3,321 | $85,735 | $5,200 | $80,535 |
| 2023 | $1,604 | $44,993 | $2,800 | $42,193 |
| 2022 | $1,671 | $44,993 | $2,800 | $42,193 |
| 2021 | $1,675 | $44,993 | $2,800 | $42,193 |
| 2020 | $1,680 | $44,993 | $2,800 | $42,193 |
| 2019 | $1,679 | $44,993 | $2,800 | $42,193 |
| 2018 | $1,504 | $42,468 | $2,800 | $39,668 |
| 2017 | $1,833 | $53,375 | $2,800 | $50,575 |
| 2016 | $1,559 | $44,623 | $2,800 | $41,823 |
| 2015 | $1,543 | $44,623 | $2,800 | $41,823 |
| 2014 | $1,544 | $44,623 | $2,800 | $41,823 |
| 2013 | -- | $39,980 | $2,800 | $37,180 |
Source: Public Records
Map
Nearby Homes
- 109 Oriac Ave SW
- 117 Pine Cir SW
- 112 Pine Cir SW
- 786 Madison Ln
- 1193 S Broad St
- 720 1st St SW
- 75 14th Ave SE
- 270 Muggridge Ln
- 460 2nd St SW
- 27 6th Ave SW
- 425 8th St SW
- 40 5th Ave SW
- 130 17th Ave SE
- 000 Hwy 111 South 20 59 Acres
- 000 S Broad St
- 490 13th St SW
- 320 8th St SW
- 198 Oakdale Rd SE
- 1310 Stone Ave
- 602 4th St SE
- 1407 Rest St SW
- 325 13th Ave SW
- 1411 Rest St SW
- 301 Mild Ave SW
- 0 Rest St SW
- 296 13th Ave SW
- 1423 Rest St SW
- 320 13th Ave SW
- 300 13th Ave SW
- 365 Mild Ave SW
- 310 Humble Ave SW
- 341 13th Ave SW
- 340 13th Ave SW
- 1289 Rest St SW
- 291 13th Ave SW
- 360 13th Ave SW
- 00 SW Humble Ave
- 320 Humble Ave SW
- 1501 Rest St SW
- 281 13th Ave SW