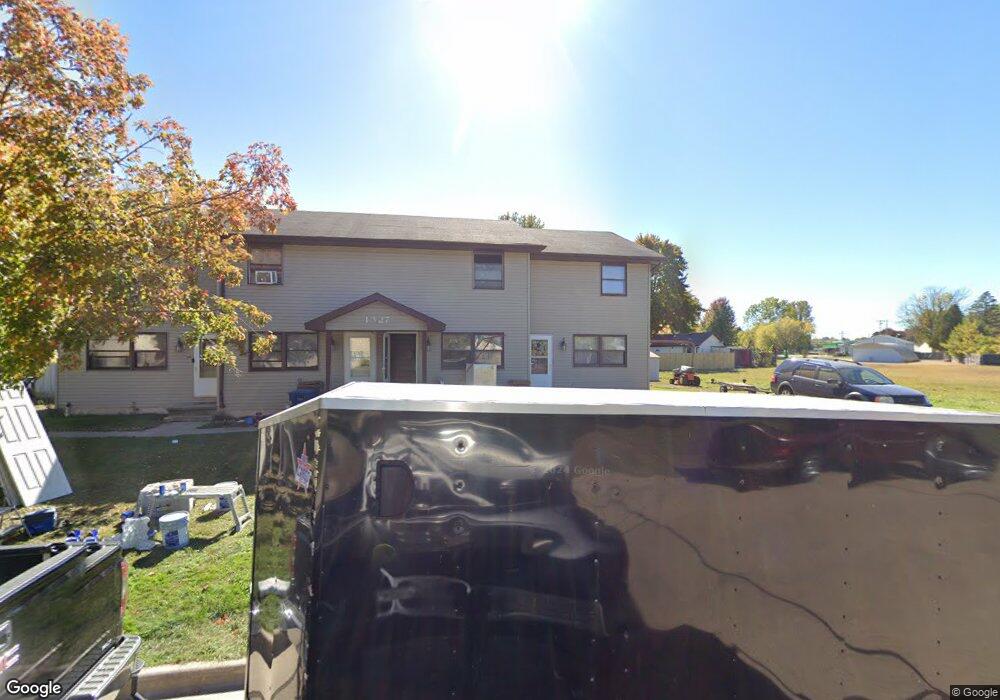
1327 Traders Rd Menasha, WI 54952
Estimated Value: $466,000
2
Beds
2
Baths
850
Sq Ft
$548/Sq Ft
Est. Value
About This Home
This home is located at 1327 Traders Rd, Menasha, WI 54952 and is currently priced at $466,000, approximately $548 per square foot. 1327 Traders Rd is a home located in Winnebago County with nearby schools including Menasha High School, St. Mary Elementary School, and St. John the Baptist School.
Ownership History
Date
Name
Owned For
Owner Type
Purchase Details
Closed on
Aug 31, 2022
Sold by
Badger One Rentals Llc
Bought by
Winch Enterprises Llc
Current Estimated Value
Home Financials for this Owner
Home Financials are based on the most recent Mortgage that was taken out on this home.
Original Mortgage
$280,000
Outstanding Balance
$266,112
Interest Rate
5.3%
Mortgage Type
New Conventional
Purchase Details
Closed on
Jun 21, 2008
Sold by
Quelle Chad J and Quelle Kristin
Bought by
Co Quelle Real Estate Investments Llc
Purchase Details
Closed on
Jan 10, 2007
Sold by
Austin Judith and Groleski Judith A
Bought by
Quelle Chad and Quelle Kristin
Home Financials for this Owner
Home Financials are based on the most recent Mortgage that was taken out on this home.
Original Mortgage
$173,600
Interest Rate
6.27%
Mortgage Type
New Conventional
Create a Home Valuation Report for This Property
The Home Valuation Report is an in-depth analysis detailing your home's value as well as a comparison with similar homes in the area
Home Values in the Area
Average Home Value in this Area
Purchase History
| Date | Buyer | Sale Price | Title Company |
|---|---|---|---|
| Winch Enterprises Llc | $350,000 | -- | |
| Co Quelle Real Estate Investments Llc | -- | None Available | |
| Qw Lle Real Estate Imtls M Nts Llc | $82,000 | -- | |
| Quelle Chad | $217,000 | None Available |
Source: Public Records
Mortgage History
| Date | Status | Borrower | Loan Amount |
|---|---|---|---|
| Open | Winch Enterprises Llc | $280,000 | |
| Previous Owner | Quelle Chad | $173,600 |
Source: Public Records
Tax History
| Year | Tax Paid | Tax Assessment Tax Assessment Total Assessment is a certain percentage of the fair market value that is determined by local assessors to be the total taxable value of land and additions on the property. | Land | Improvement |
|---|---|---|---|---|
| 2024 | $6,380 | $319,200 | $31,500 | $287,700 |
| 2023 | $5,464 | $207,500 | $26,000 | $181,500 |
| 2022 | $4,383 | $169,400 | $26,000 | $143,400 |
| 2021 | $4,555 | $173,800 | $26,000 | $147,800 |
| 2020 | $5,161 | $173,800 | $26,000 | $147,800 |
| 2019 | $4,697 | $173,800 | $26,000 | $147,800 |
| 2018 | $4,942 | $164,100 | $26,200 | $137,900 |
| 2017 | $6,135 | $164,100 | $26,200 | $137,900 |
| 2016 | $4,925 | $164,100 | $26,200 | $137,900 |
| 2015 | $5,930 | $164,100 | $26,200 | $137,900 |
| 2014 | $4,896 | $164,100 | $26,200 | $137,900 |
| 2013 | $5,411 | $164,100 | $26,200 | $137,900 |
Source: Public Records
Map
Nearby Homes
- 980 8th St
- 1025 Greendale Ct
- 936 Lincoln St
- 716 Elizabeth Ct
- 957 Brighton Dr
- 917 Jefferson St
- 1029 Alva St
- 995 Brighton Dr
- 837 Harding St
- 867 Plank Rd
- 1783 Brighton Beach Rd
- 950 Clover St
- 658 Appleton Rd
- 1025 Oneida St
- 812 1st St
- 724 2nd St
- 727 1st St
- 0 Wittmann Dr Unit 50300070
- 0 Wittmann Dr Unit 50300069
- 1327 Province Terrace
- 0 Traders Rd
- 1292 Plank Rd
- 1298 Plank Rd
- 1290 Plank Rd
- 1332 Traders Rd
- 1332 Trader Rd
- 1306 Plank Rd
- 1105 Manitowoc Rd
- 1101 Manitowoc Rd
- 1069 Manitowoc Rd
- 1117 Manitowoc Rd
- 1121 Manitowoc Rd
- 1063 Manitowoc Rd
- 1112 Manitowoc Rd
- 1086 Manitowoc Rd
- 1080 Manitowoc Rd
- 1360 Plank Rd
- 1074 Manitowoc Rd
- 1070 Manitowoc Rd
- 1064 Manitowoc Rd
Your Personal Tour Guide
Ask me questions while you tour the home.