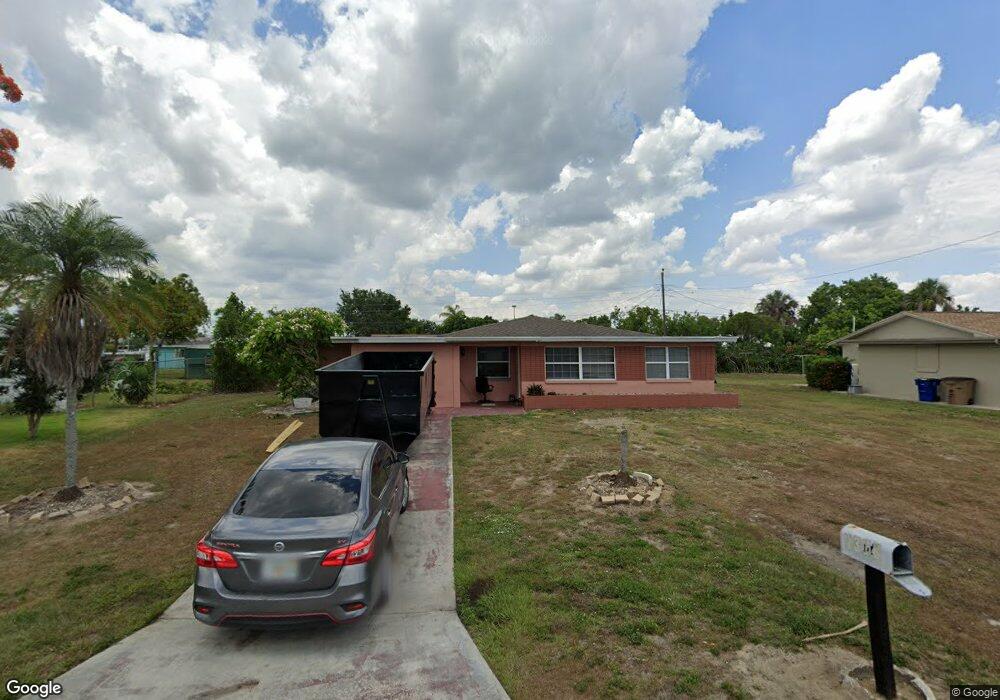
1328 Ellendale Cir Lehigh Acres, FL 33936
Richmond NeighborhoodEstimated Value: $151,000 - $256,000
3
Beds
2
Baths
1,316
Sq Ft
$161/Sq Ft
Est. Value
About This Home
This home is located at 1328 Ellendale Cir, Lehigh Acres, FL 33936 and is currently estimated at $211,716, approximately $160 per square foot. 1328 Ellendale Cir is a home located in Lee County with nearby schools including Lehigh Elementary School, Gateway Elementary School, and The Alva School.
Ownership History
Date
Name
Owned For
Owner Type
Purchase Details
Closed on
Mar 15, 2015
Sold by
Joffe Gai Aharon and Joffe Talya
Bought by
Joffe Holdings Llc
Current Estimated Value
Purchase Details
Closed on
Jun 28, 2013
Sold by
Sababa Holdings Llp
Bought by
Joffe Gai Aharon and Joffe Talya
Purchase Details
Closed on
May 10, 2013
Sold by
Stott James Michael
Bought by
Sababa Holdings Llp
Purchase Details
Closed on
May 2, 2007
Sold by
Walker Henry Lee and Walker Andrea
Bought by
Stott James Michael
Home Financials for this Owner
Home Financials are based on the most recent Mortgage that was taken out on this home.
Original Mortgage
$80,000
Interest Rate
9.07%
Mortgage Type
Unknown
Purchase Details
Closed on
May 29, 1998
Sold by
Gayleard Mary K and Gayleard Wlater R
Bought by
Walker Henry Lee
Home Financials for this Owner
Home Financials are based on the most recent Mortgage that was taken out on this home.
Original Mortgage
$47,955
Interest Rate
7.11%
Mortgage Type
FHA
Create a Home Valuation Report for This Property
The Home Valuation Report is an in-depth analysis detailing your home's value as well as a comparison with similar homes in the area
Home Values in the Area
Average Home Value in this Area
Purchase History
| Date | Buyer | Sale Price | Title Company |
|---|---|---|---|
| Joffe Holdings Llc | -- | Attorney | |
| Joffe Gai Aharon | $54,000 | Peer Title Inc | |
| Sababa Holdings Llp | $47,000 | Security Title & Abstract Ll | |
| Stott James Michael | $100,000 | Platinum Land Title Agency I | |
| Walker Henry Lee | $47,500 | -- |
Source: Public Records
Mortgage History
| Date | Status | Borrower | Loan Amount |
|---|---|---|---|
| Previous Owner | Stott James Michael | $80,000 | |
| Previous Owner | Walker Henry Lee | $47,955 |
Source: Public Records
Tax History Compared to Growth
Tax History
| Year | Tax Paid | Tax Assessment Tax Assessment Total Assessment is a certain percentage of the fair market value that is determined by local assessors to be the total taxable value of land and additions on the property. | Land | Improvement |
|---|---|---|---|---|
| 2025 | $2,358 | $128,905 | -- | -- |
| 2024 | $2,237 | $117,186 | -- | -- |
| 2023 | $2,237 | $106,533 | $0 | $0 |
| 2022 | $2,054 | $96,848 | $0 | $0 |
| 2021 | $1,764 | $109,437 | $9,500 | $99,937 |
| 2020 | $1,687 | $102,554 | $8,500 | $94,054 |
| 2019 | $1,664 | $90,441 | $8,100 | $82,341 |
| 2018 | $1,563 | $81,987 | $7,600 | $74,387 |
| 2017 | $1,498 | $79,949 | $7,560 | $72,389 |
| 2016 | $1,314 | $59,417 | $7,839 | $51,578 |
| 2015 | $1,206 | $49,698 | $6,542 | $43,156 |
| 2014 | $983 | $45,205 | $4,741 | $40,464 |
| 2013 | -- | $36,701 | $3,008 | $33,693 |
Source: Public Records
Map
Nearby Homes
- 1313 Ellendale Cir
- 1313 Farmdale St
- 1399 Juddale St E
- 1417 Irondale St E
- 327 Allenwood Ave
- 340 Grovewood Ave S
- 1202 Archdale St
- 220 Oakmont Pkwy
- 312 Grovewood Ave S
- 227 Beth Stacey Blvd
- 211 Oakmont Pkwy
- 217 Beth Stacey Blvd
- 1521 Huntdale St E
- 209 Rockcliff Ave
- 1111 Village Lakes Blvd
- 1101 Coolidge Ave
- 18437 Orangecrest Ct
- 18409 Orangecrest Ct
- 1001 Coolidge Ave
- 1423 Alwynne Dr
- 1330 Ellendale Cir
- 1326 Ellendale Cir
- 1312 Barnsdale St
- 1314 Barnsdale St
- 1310 Barnsdale St
- 1324 Ellendale Cir
- 1315 Ellendale Cir
- 1332 Ellendale Cir
- 1316 Barnsdale St
- 1317 Ellendale Cir
- 1308 Barnsdale St
- 1322 Ellendale Cir
- 343 Fleetwood Ave
- 1319 Ellendale Cir
- 1334 Ellendale Cir
- 1313 Barnsdale St
- 339 Fleetwood Ave
- 1306 Barnsdale St
- 1311 Ellendale Cir
- 1315 Barnsdale St