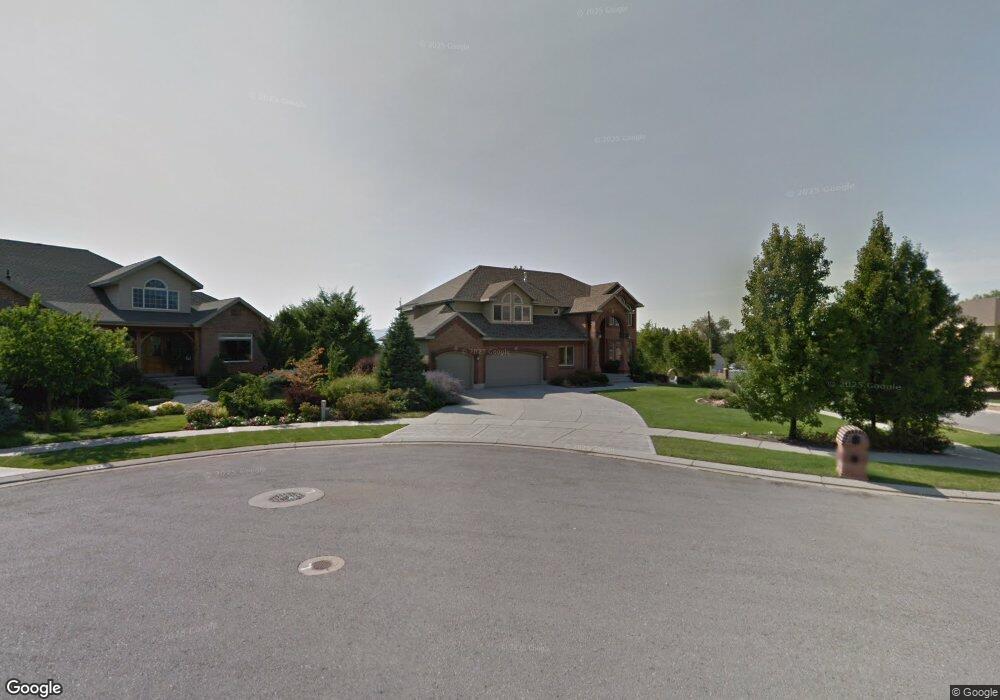
1328 Hanna Ct Draper, UT 84020
Estimated Value: $1,365,000 - $1,640,000
6
Beds
4
Baths
3,279
Sq Ft
$454/Sq Ft
Est. Value
About This Home
This home is located at 1328 Hanna Ct, Draper, UT 84020 and is currently estimated at $1,487,387, approximately $453 per square foot. 1328 Hanna Ct is a home located in Salt Lake County with nearby schools including Draper Elementary School, Draper Park Middle School, and Corner Canyon High School.
Ownership History
Date
Name
Owned For
Owner Type
Purchase Details
Closed on
Oct 14, 2011
Sold by
Ross Douglas S
Bought by
Bruns Daniel Robert and Bruns Lisa Ann
Current Estimated Value
Home Financials for this Owner
Home Financials are based on the most recent Mortgage that was taken out on this home.
Original Mortgage
$408,000
Outstanding Balance
$278,942
Interest Rate
4.15%
Mortgage Type
New Conventional
Estimated Equity
$1,208,445
Purchase Details
Closed on
Jul 6, 2004
Sold by
Ross Douglas S and Ross Karen A
Bought by
Ross Douglas S
Purchase Details
Closed on
Apr 24, 2000
Sold by
Roger Chase Construction Inc
Bought by
Ross Douglas S
Home Financials for this Owner
Home Financials are based on the most recent Mortgage that was taken out on this home.
Original Mortgage
$360,000
Interest Rate
7.75%
Purchase Details
Closed on
Jun 23, 1999
Sold by
Red Tree Land Company Lc
Bought by
Roger Chase Construction Inc
Create a Home Valuation Report for This Property
The Home Valuation Report is an in-depth analysis detailing your home's value as well as a comparison with similar homes in the area
Home Values in the Area
Average Home Value in this Area
Purchase History
| Date | Buyer | Sale Price | Title Company |
|---|---|---|---|
| Bruns Daniel Robert | -- | Cottonwood Title | |
| Ross Douglas S | -- | -- | |
| Ross Douglas S | -- | Backman Stewart Title Servic | |
| Roger Chase Construction Inc | -- | Legacy Land Title |
Source: Public Records
Mortgage History
| Date | Status | Borrower | Loan Amount |
|---|---|---|---|
| Open | Bruns Daniel Robert | $408,000 | |
| Previous Owner | Ross Douglas S | $360,000 |
Source: Public Records
Tax History
| Year | Tax Paid | Tax Assessment Tax Assessment Total Assessment is a certain percentage of the fair market value that is determined by local assessors to be the total taxable value of land and additions on the property. | Land | Improvement |
|---|---|---|---|---|
| 2025 | $6,581 | $1,299,100 | $409,100 | $890,000 |
| 2024 | $6,581 | $1,257,100 | $393,800 | $863,300 |
| 2023 | $6,377 | $1,209,200 | $378,600 | $830,600 |
| 2022 | $6,546 | $1,199,000 | $371,200 | $827,800 |
| 2021 | $5,258 | $822,700 | $324,800 | $497,900 |
| 2020 | $5,271 | $781,800 | $307,400 | $474,400 |
| 2019 | $5,295 | $767,300 | $294,500 | $472,800 |
| 2016 | $4,420 | $609,500 | $265,400 | $344,100 |
Source: Public Records
Map
Nearby Homes
- 13050 S 1300 E
- 13216 S Telemark Ln
- 13454 Tuscalee Way
- 13818 S Vestry Rd Unit 59
- 1518 Stanford Ct
- 963 Old English Rd
- 13543 S Aintree Ave
- 1709 E Richey Rd
- 14013 S Pine Mesa Dr
- 12959 S Fort St
- 919 E 13800 S
- 12397 S Relation St Unit 1
- 12882 S Ellerbeck Ln Unit 12882
- 1285 Manfield Way
- 12567 Blacksmith Ln
- 12838 Hickory Ridge Ln
- 12525 S 1300 E
- 14133 S Spyglass Hill Dr
- 847 E Willow Springs Ln
- 14146 S Spyglass Hill Dr
- 1328 E Hanna Ct
- 1328 Hana Ct
- 1338 Hanna Ct
- 1327 Nashi Ln
- 13338 S Nashi Ln
- 13338 Nashi Ln
- 1327 E Nashi Ln
- 1346 Hanna Ct
- 1346 E Hanna Ct
- 1366 Lindsay Grove Ct
- 1366 E Lindsay Grove Ct
- 1364 Lindsay Grove Ct
- 13307 S 1300 E
- 13332 S 1300 E
- 1323 E 13430 S
- 13318 Nashi Ln
- 13318 S Nashi Ln
- 13417 S 1300 E
- 1339 E 13430 S
- 13318 S 1300 E
Your Personal Tour Guide
Ask me questions while you tour the home.