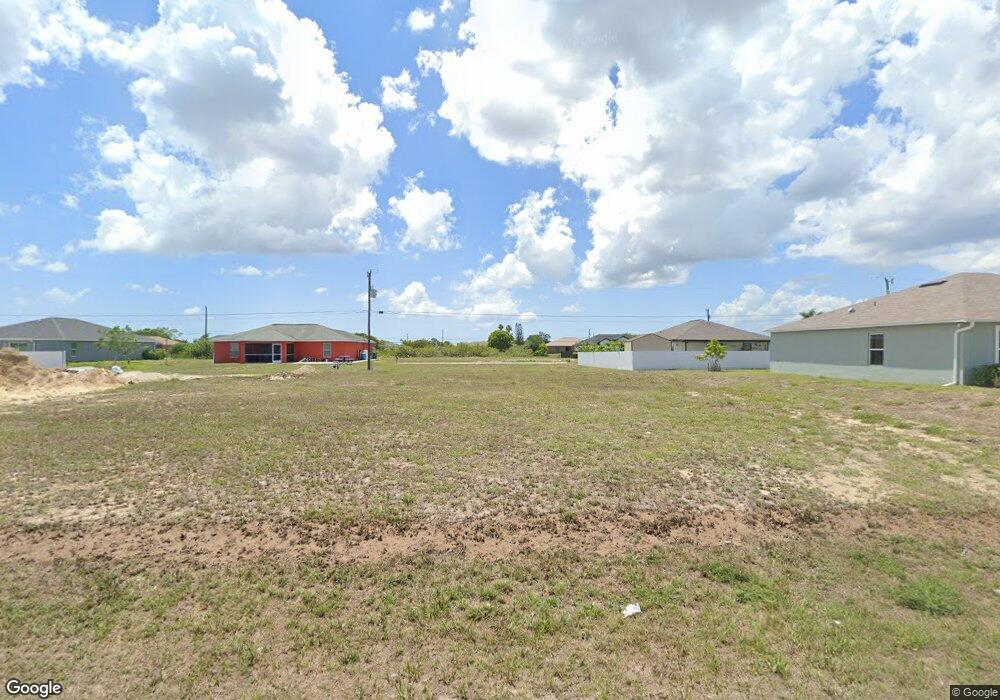
1328 NE 9th Place Unit 53 Cape Coral, FL 33909
Diplomat NeighborhoodEstimated Value: $47,000 - $194,000
--
Bed
--
Bath
--
Sq Ft
10,019
Sq Ft Lot
About This Home
This home is located at 1328 NE 9th Place Unit 53, Cape Coral, FL 33909 and is currently estimated at $85,480. 1328 NE 9th Place Unit 53 is a home located in Lee County with nearby schools including Dr. Carrie D. Robinson Littleton Elementary School, Caloosa Elementary School, and Tropic Isles Elementary School.
Ownership History
Date
Name
Owned For
Owner Type
Purchase Details
Closed on
Sep 22, 2025
Sold by
Sragowicz George
Bought by
Najmi Realty Llc
Current Estimated Value
Purchase Details
Closed on
Mar 15, 2022
Sold by
Lee County
Purchase Details
Closed on
Sep 26, 2016
Sold by
Qgp Llc
Bought by
Foong Shin Har Llc
Purchase Details
Closed on
Aug 22, 2016
Sold by
Hirtz Md S Kathleen
Bought by
Qgp Llc
Purchase Details
Closed on
Mar 24, 2009
Sold by
Great Abe Llc
Bought by
Hirtz S Kathleen and Md 401K Profit Sharing Plan
Purchase Details
Closed on
Jan 23, 2009
Sold by
County Of Lee
Bought by
Great Abe Llc
Purchase Details
Closed on
Apr 24, 2007
Sold by
Sullivan Paul R
Bought by
Quickbling Investment Corp
Purchase Details
Closed on
Nov 7, 2003
Sold by
Bell Lane Robert Timothy and Bell Hoyle Clara
Bought by
M J D Group Inc
Create a Home Valuation Report for This Property
The Home Valuation Report is an in-depth analysis detailing your home's value as well as a comparison with similar homes in the area
Home Values in the Area
Average Home Value in this Area
Purchase History
| Date | Buyer | Sale Price | Title Company |
|---|---|---|---|
| Najmi Realty Llc | $40,000 | Victory Title | |
| -- | $33,118 | None Listed On Document | |
| Foong Shin Har Llc | $23,000 | None Available | |
| Qgp Llc | $7,500 | None Available | |
| Hirtz S Kathleen | $13,800 | Wilkinson Title Agency Inc | |
| Great Abe Llc | $4,668 | None Available | |
| Quickbling Investment Corp | $13,000 | None Available | |
| M J D Group Inc | $1,300 | -- |
Source: Public Records
Tax History Compared to Growth
Tax History
| Year | Tax Paid | Tax Assessment Tax Assessment Total Assessment is a certain percentage of the fair market value that is determined by local assessors to be the total taxable value of land and additions on the property. | Land | Improvement |
|---|---|---|---|---|
| 2025 | $4,532 | $36,338 | $36,338 | -- |
| 2024 | $1,018 | $39,537 | -- | -- |
| 2023 | $1,018 | $35,943 | $29,364 | $0 |
| 2022 | $619 | $9,680 | $0 | $0 |
| 2021 | $517 | $10,600 | $10,600 | $0 |
| 2020 | $472 | $8,000 | $8,000 | $0 |
| 2019 | $531 | $13,000 | $13,000 | $0 |
| 2018 | $505 | $11,000 | $11,000 | $0 |
| 2017 | $479 | $10,821 | $10,821 | $0 |
| 2016 | $366 | $7,000 | $7,000 | $0 |
| 2015 | $334 | $6,500 | $6,500 | $0 |
| 2014 | $274 | $5,922 | $5,922 | $0 |
| 2013 | -- | $4,600 | $4,600 | $0 |
Source: Public Records
Map
Nearby Homes
- 1421 NE 9th Ave
- 1318 NE 9th Ave
- 1420 NE 9th Ave
- 1314 NE 9th Ave
- 1424 NE 9th Ave
- 1013 NE 15th St
- 1503 NE 13th Terrace
- 1427 NE 8th Place
- 1309 NE 8th Place
- 1503 NE 8th Place
- 901 NE 15th Terrace
- 1121 NE 14th Terrace
- 1025 NE 15th Terrace
- 1206 NE 9th Ave
- 832 NE 15th Ln
- 833 NE 15th Ln
- 825 NE 15th Ln
- 602 NE 12th St
- 1118 NE 12th St
- 614 NE 12th St
- 1328 NE 9th Place
- 1332 NE 9th Place
- 1325 NE 9th Ave
- 1333 NE 9th Ave
- 1320 NE 9th Place
- 1331 NE 9th Place
- 1321 NE 9th Ave
- 1405 NE 9th Ave
- 1323 NE 9th Place
- 1401 NE 9th Place
- 1316 NE 9th Place
- 1317 NE 9th Ave
- 1408 NE 9th Place
- 1326 NE 10th Ave
- 1315 NE 9th Place
- 1334 NE 9th Ave
- 1312 NE 9th Place
- 1322 NE 9th Ave
- 1400 NE 10th Ave
- 1313 NE 9th Ave