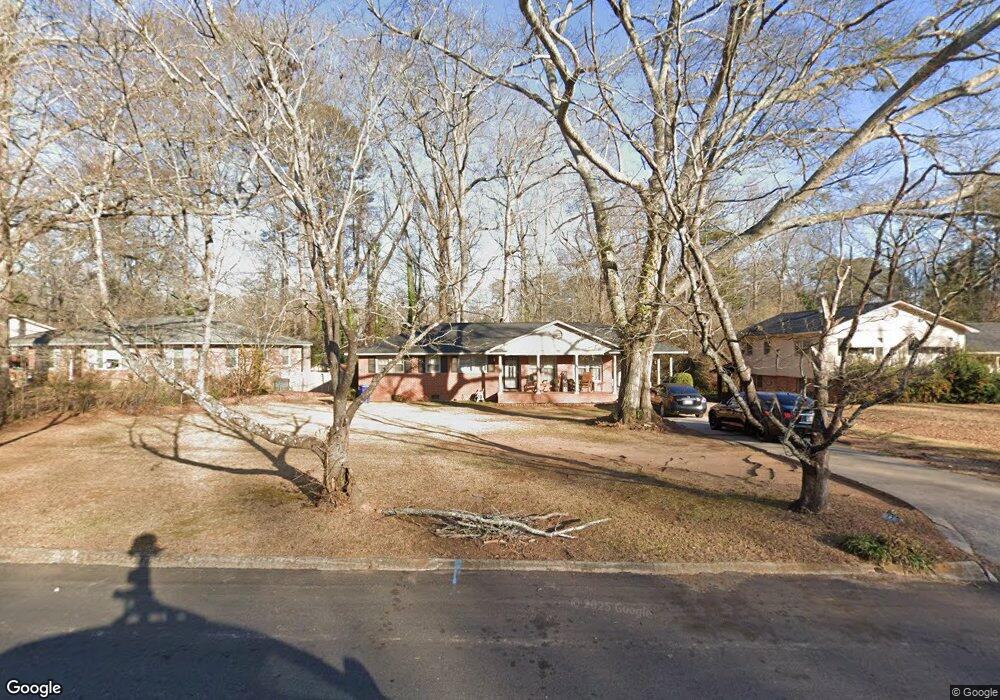
1328 Oakdale Dr Griffin, GA 30224
Spalding County NeighborhoodEstimated Value: $118,000 - $172,088
3
Beds
1
Bath
1,300
Sq Ft
$116/Sq Ft
Est. Value
About This Home
This home is located at 1328 Oakdale Dr, Griffin, GA 30224 and is currently estimated at $151,022, approximately $116 per square foot. 1328 Oakdale Dr is a home located in Spalding County with nearby schools including Anne Street Elementary School, Rehoboth Road Middle School, and Griffin High School.
Ownership History
Date
Name
Owned For
Owner Type
Purchase Details
Closed on
Aug 30, 2007
Sold by
Citifinancial Services Inc
Bought by
Smith Fleming E and Chadwick Randy
Current Estimated Value
Home Financials for this Owner
Home Financials are based on the most recent Mortgage that was taken out on this home.
Original Mortgage
$65,103
Interest Rate
6.57%
Mortgage Type
New Conventional
Purchase Details
Closed on
Feb 6, 2007
Sold by
Talley Jack S and Talley Katie M
Bought by
Citifinancisl Svcs Inc
Purchase Details
Closed on
Jun 10, 1983
Bought by
Talley Jack S
Purchase Details
Closed on
Jun 1, 1977
Sold by
Lentz John M and Lentz Barbara
Bought by
Talley Jack S
Purchase Details
Closed on
Mar 1, 1973
Sold by
Reeves Dorothy R
Bought by
Lentz John M and Lentz Barbara B
Purchase Details
Closed on
Feb 1, 1972
Sold by
Reeves Jerry B
Bought by
Reeves Dorothy R
Purchase Details
Closed on
Jan 24, 1964
Bought by
Reeves Jerry R
Create a Home Valuation Report for This Property
The Home Valuation Report is an in-depth analysis detailing your home's value as well as a comparison with similar homes in the area
Home Values in the Area
Average Home Value in this Area
Purchase History
| Date | Buyer | Sale Price | Title Company |
|---|---|---|---|
| Smith Fleming E | $63,500 | -- | |
| Citifinancisl Svcs Inc | $63,900 | -- | |
| Talley Jack S | -- | -- | |
| Talley Jack S | $31,000 | -- | |
| Lentz John M | $24,000 | -- | |
| Reeves Dorothy R | -- | -- | |
| Reeves Jerry R | $18,200 | -- |
Source: Public Records
Mortgage History
| Date | Status | Borrower | Loan Amount |
|---|---|---|---|
| Closed | Smith Fleming E | $65,103 |
Source: Public Records
Tax History Compared to Growth
Tax History
| Year | Tax Paid | Tax Assessment Tax Assessment Total Assessment is a certain percentage of the fair market value that is determined by local assessors to be the total taxable value of land and additions on the property. | Land | Improvement |
|---|---|---|---|---|
| 2024 | $1,760 | $46,102 | $7,200 | $38,902 |
| 2023 | $1,760 | $44,163 | $7,200 | $36,963 |
| 2022 | $1,599 | $40,008 | $6,000 | $34,008 |
| 2021 | $1,111 | $27,800 | $4,000 | $23,800 |
| 2020 | $956 | $23,932 | $4,000 | $19,932 |
| 2019 | $974 | $23,932 | $4,000 | $19,932 |
| 2018 | $927 | $21,945 | $4,000 | $17,945 |
| 2017 | $907 | $21,945 | $4,000 | $17,945 |
| 2016 | $961 | $22,883 | $4,000 | $18,883 |
| 2015 | $977 | $22,883 | $4,000 | $18,883 |
| 2014 | $1,006 | $22,883 | $4,000 | $18,883 |
Source: Public Records
Map
Nearby Homes
- 1326 Oakdale Dr
- 1228-1328 Edgewood Ave
- 1313 D F Fuller Dr
- 1022 Beck St
- 820 Pamela Dr
- 825 Pamela Dr
- 450 Carver
- 1264 Cherokee Ave
- 309 Cherokee Cir
- 1054 W College Street Extension
- 305 S 18th St
- 1611 Piedmont Rd
- 1740 Summerwoods Ln
- 1012 W College Extension
- 1613 Carriage Hills Dr
- 717 Scales St
- 731 Scales St
- 854 Scales St
- 754 Scales St
- 811 Westbrook St
- 1330 Oakdale Dr Unit LT 22 &23
- 1330 Oakdale Dr
- 1330 Oakdale Dr
- 1324 Oakdale Dr
- 1317 Greenview Dr
- 1313 Greenview Dr
- 1322 Oakdale Dr
- 1331 Oakdale Dr
- 1329 Oakdale Dr
- 1334 Oakdale Dr
- 1319 Greenview Dr
- 1333 Oakdale Dr
- 1327 Oakdale Dr
- 1311 Greenview Dr
- 1325 Oakdale Dr
- 1321 Greenview Dr
- 1336 Oakdale Dr
- 1335 Oakdale Dr
- 1323 Oakdale Dr
- 1320 Oakdale Dr