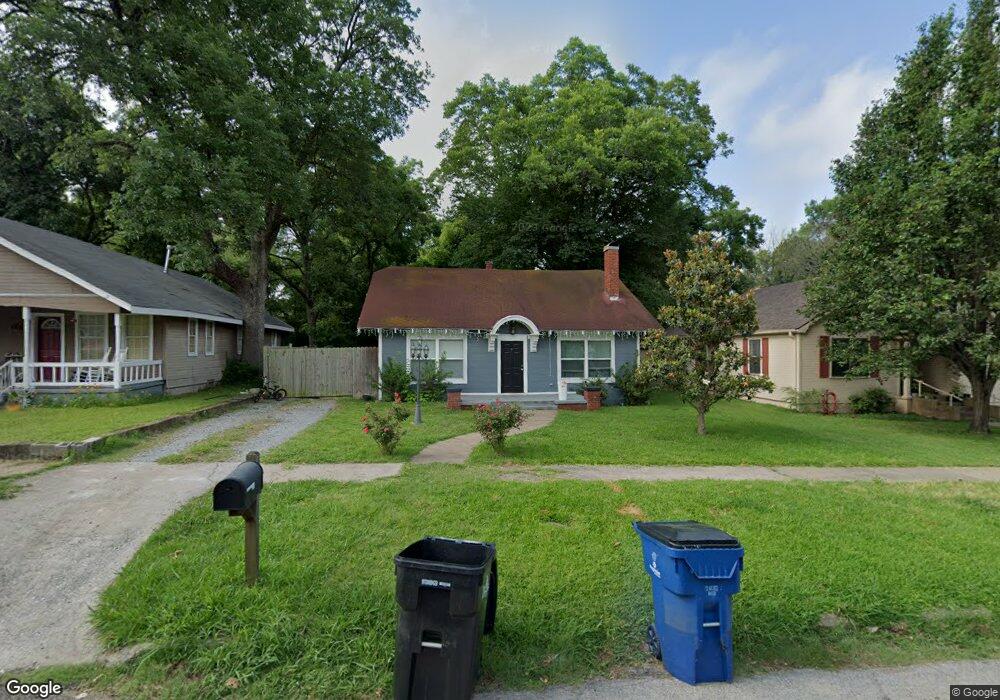
1328 W Gandy St Denison, TX 75020
Estimated Value: $199,000 - $234,290
6
Beds
3
Baths
2,275
Sq Ft
$95/Sq Ft
Est. Value
About This Home
This home is located at 1328 W Gandy St, Denison, TX 75020 and is currently estimated at $216,645, approximately $95 per square foot. 1328 W Gandy St is a home located in Grayson County with nearby schools including Terrell Elementary School, Scott Middle School, and Denison High School.
Ownership History
Date
Name
Owned For
Owner Type
Purchase Details
Closed on
Apr 9, 2021
Sold by
Coffey Jeffrey P
Bought by
Coffey Susanne
Current Estimated Value
Purchase Details
Closed on
Oct 16, 2019
Sold by
Goss Andrew D and Goss Monica S
Bought by
Coffey Jeffrey P
Purchase Details
Closed on
Jan 24, 2018
Bought by
Goss Andrew D
Home Financials for this Owner
Home Financials are based on the most recent Mortgage that was taken out on this home.
Original Mortgage
$112,917
Interest Rate
4.04%
Purchase Details
Closed on
Feb 9, 2011
Sold by
Citifinancial Inc
Bought by
Kelley Don and Kelley Carol
Home Financials for this Owner
Home Financials are based on the most recent Mortgage that was taken out on this home.
Original Mortgage
$39,900
Interest Rate
4.79%
Mortgage Type
Purchase Money Mortgage
Purchase Details
Closed on
Sep 8, 2010
Sold by
Kincaid Malon Earl and Kincaid Deborah Dughetti
Bought by
Citifinancial Inc
Create a Home Valuation Report for This Property
The Home Valuation Report is an in-depth analysis detailing your home's value as well as a comparison with similar homes in the area
Home Values in the Area
Average Home Value in this Area
Purchase History
| Date | Buyer | Sale Price | Title Company |
|---|---|---|---|
| Coffey Susanne | -- | Sendera Title | |
| Coffey Jeffrey P | -- | None Available | |
| Goss Andrew D | -- | -- | |
| Kelley Don | -- | Lsi Title Agency Inc | |
| Citifinancial Inc | $62,574 | None Available |
Source: Public Records
Mortgage History
| Date | Status | Borrower | Loan Amount |
|---|---|---|---|
| Previous Owner | Goss Andrew D | $112,917 | |
| Previous Owner | Goss Andrew D | -- | |
| Previous Owner | Kelley Don | $39,900 |
Source: Public Records
Tax History Compared to Growth
Tax History
| Year | Tax Paid | Tax Assessment Tax Assessment Total Assessment is a certain percentage of the fair market value that is determined by local assessors to be the total taxable value of land and additions on the property. | Land | Improvement |
|---|---|---|---|---|
| 2025 | $4,220 | $191,176 | $43,125 | $148,051 |
| 2024 | $4,220 | $181,633 | $47,250 | $134,383 |
| 2023 | $3,981 | $175,697 | $40,875 | $134,822 |
| 2022 | $3,892 | $163,806 | $40,875 | $122,931 |
| 2021 | $2,811 | $111,456 | $20,250 | $91,206 |
| 2020 | $3,171 | $120,211 | $15,000 | $105,211 |
| 2019 | $3,313 | $120,381 | $12,450 | $107,931 |
| 2018 | $3,240 | $116,803 | $9,000 | $107,803 |
| 2017 | $2,238 | $80,000 | $9,000 | $71,000 |
| 2016 | $1,339 | $47,861 | $9,000 | $38,861 |
| 2015 | $1,190 | $42,111 | $3,150 | $38,961 |
| 2014 | $1,136 | $40,217 | $3,150 | $37,067 |
Source: Public Records
Map
Nearby Homes
- 1315 W Gandy St
- 1230 W Woodard St
- 108 N Eddy Ave
- 1231 W Main St
- 1208 W Sears St
- 1200 W Gandy St
- 1320 W Morton St
- 1309 W Morton St
- 1123 W Sears St
- 1111 W Sears St
- 1531 W Main St
- 1031 W Gandy St
- 1221 W Crawford St
- 1609 W Woodard St
- 1326 W Crawford St
- 3030 W Morton St
- 1700 W Morton St
- 3300 W Morton St
- 2900 W Morton St
- 3130 W Morton St
- 1330 W Gandy St
- 1318 W Gandy St
- 1316 W Gandy St
- 1327 W Woodard St
- 1331 W Woodard St
- 1325 W Woodard St
- 1400 W Gandy St
- 1317 W Woodard St
- 1315 W Woodard St
- 1406 W Gandy St
- 1331 W Gandy St
- 1327 W Gandy St
- 231 N Eddy Ave
- 1401 W Woodard St
- 1319 W Gandy St
- 1311 W Woodard St
- 1315 W Gandy St
- 1401 W Gandy St
- 1307 W Woodard St
- 1411 W Woodard St