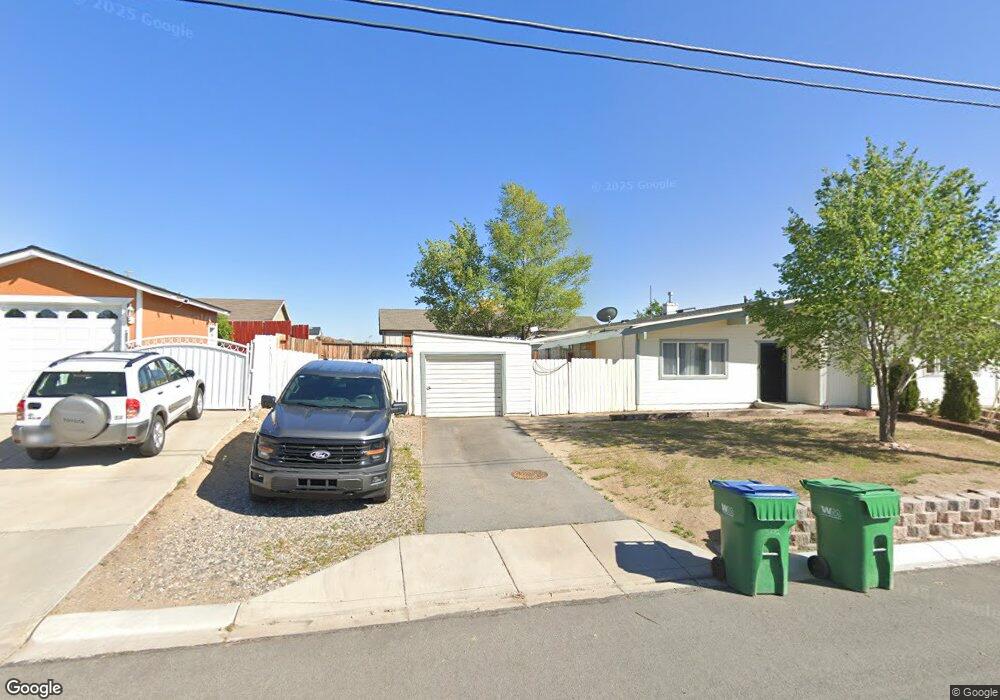
13282 Mount Whitney St Reno, NV 89506
Stead NeighborhoodEstimated Value: $316,143 - $327,000
3
Beds
1
Bath
1,189
Sq Ft
$270/Sq Ft
Est. Value
About This Home
This home is located at 13282 Mount Whitney St, Reno, NV 89506 and is currently estimated at $321,036, approximately $270 per square foot. 13282 Mount Whitney St is a home located in Washoe County with nearby schools including Desert Heights Elementary School, William O'Brien Middle School, and North Valleys High School.
Ownership History
Date
Name
Owned For
Owner Type
Purchase Details
Closed on
Apr 15, 2016
Sold by
Swope Tracy L
Bought by
Bryce Kenneth W and Austin Rheadonna
Current Estimated Value
Home Financials for this Owner
Home Financials are based on the most recent Mortgage that was taken out on this home.
Original Mortgage
$146,301
Outstanding Balance
$118,787
Interest Rate
4.37%
Mortgage Type
FHA
Estimated Equity
$202,249
Purchase Details
Closed on
Mar 19, 2009
Sold by
Swope Patsy K
Bought by
Swope Tracy L
Purchase Details
Closed on
Mar 16, 2006
Sold by
Swope Patsy K
Bought by
Swope Patsy K and The Patsy K Swope Trust
Purchase Details
Closed on
Jan 4, 1999
Sold by
Schauer Dale W and Schauer Linda L
Bought by
Swope Patsy K
Home Financials for this Owner
Home Financials are based on the most recent Mortgage that was taken out on this home.
Original Mortgage
$43,200
Interest Rate
6.73%
Create a Home Valuation Report for This Property
The Home Valuation Report is an in-depth analysis detailing your home's value as well as a comparison with similar homes in the area
Home Values in the Area
Average Home Value in this Area
Purchase History
| Date | Buyer | Sale Price | Title Company |
|---|---|---|---|
| Bryce Kenneth W | $149,000 | Western Title Co | |
| Swope Tracy L | $90,000 | None Available | |
| Swope Patsy K | -- | None Available | |
| Swope Patsy K | $54,500 | First American Title Co |
Source: Public Records
Mortgage History
| Date | Status | Borrower | Loan Amount |
|---|---|---|---|
| Open | Bryce Kenneth W | $146,301 | |
| Previous Owner | Swope Patsy K | $43,200 |
Source: Public Records
Tax History Compared to Growth
Tax History
| Year | Tax Paid | Tax Assessment Tax Assessment Total Assessment is a certain percentage of the fair market value that is determined by local assessors to be the total taxable value of land and additions on the property. | Land | Improvement |
|---|---|---|---|---|
| 2025 | $565 | $39,253 | $26,068 | $13,185 |
| 2024 | $565 | $38,031 | $24,738 | $13,293 |
| 2023 | $524 | $34,922 | $23,375 | $11,547 |
| 2022 | $486 | $28,902 | $19,252 | $9,650 |
| 2021 | $451 | $22,579 | $13,067 | $9,512 |
| 2020 | $423 | $22,321 | $12,934 | $9,387 |
| 2019 | $403 | $21,194 | $12,303 | $8,891 |
| 2018 | $384 | $15,972 | $7,448 | $8,524 |
| 2017 | $369 | $15,055 | $6,750 | $8,305 |
| 2016 | $360 | $13,574 | $5,220 | $8,354 |
| 2015 | $270 | $11,656 | $3,392 | $8,264 |
| 2014 | $349 | $10,323 | $2,627 | $7,696 |
| 2013 | -- | $9,147 | $1,663 | $7,484 |
Source: Public Records
Map
Nearby Homes
- 14345 Murdoch Dr
- 13161 Mount Logan St
- 14390 Loyola Dr
- 14350 Loyola Dr
- 14312 Durham Dr
- 13570 Mount Rainier St
- 13440 Fort Sage Ct
- 13631 Mount Rainier St
- 14388 Durham Dr
- 14412 Leiden Dr
- 14405 Durham Dr
- 13630 Mount Whitney St
- 13990 Lear Blvd
- 11008 Zeolite Dr
- 13790 Mount Babcock St
- 11043 Athabasca Dr
- 10965 Bloomsburg Dr
- 10038 Humite Ln
- 14448 Fredonia Dr
- 11006 Athabasca Dr
- 13280 Mount Whitney St
- 13290 Mount Whitney St
- 14191 Stead Blvd
- 14201 Stead Blvd
- 14181 Stead Blvd
- 13292 Mount Whitney St
- 13262 Mount Whitney St
- 13273 Mount Whitney St
- 13271 Mount Whitney St
- 13285 Mount Whitney St
- 14211 Stead Blvd
- 14171 Stead Blvd
- 13310 Mount Whitney St Unit 1
- 13260 Mount Whitney St
- 13253 Mount Whitney St Unit 1
- 13305 Mount Whitney St Unit 1
- 13305 Mount Whitney St
- 14161 Stead Blvd
- 13251 Mount Whitney St
- 13321 Mount Whitney St