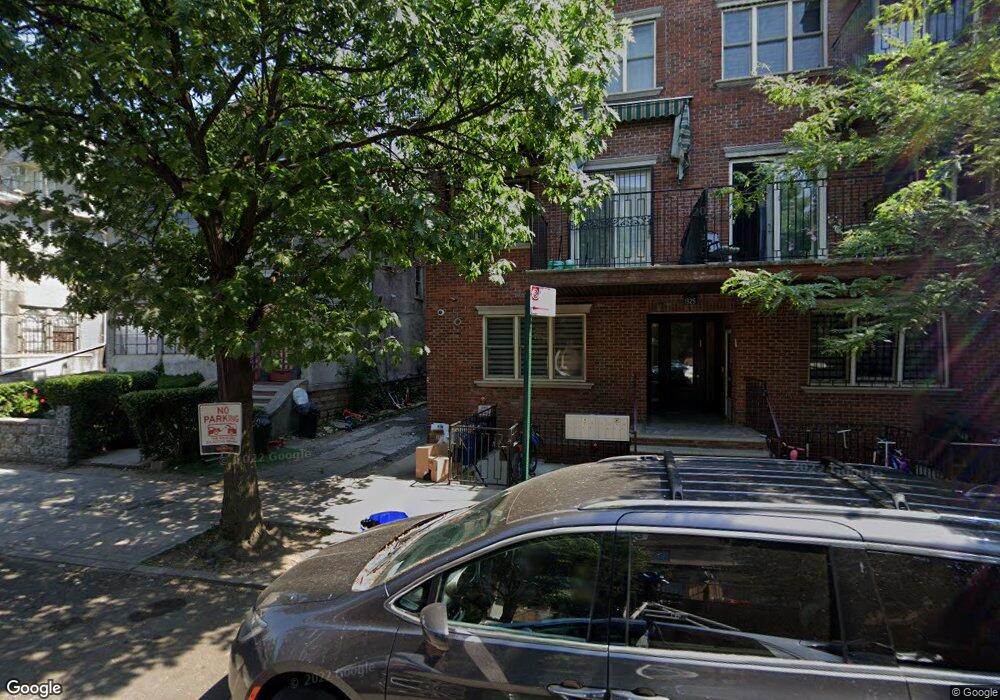
1329-1331 47th St Unit 2 Brooklyn, NY 11219
Borough Park NeighborhoodEstimated Value: $1,037,000 - $1,414,000
--
Bed
--
Bath
1,693
Sq Ft
$699/Sq Ft
Est. Value
About This Home
This home is located at 1329-1331 47th St Unit 2, Brooklyn, NY 11219 and is currently estimated at $1,182,835, approximately $698 per square foot. 1329-1331 47th St Unit 2 is a home located in Kings County with nearby schools including P.S. 164 Caesar Rodney School, I.S. 223 The Montauk, and Franklin Delano Roosevelt High School.
Create a Home Valuation Report for This Property
The Home Valuation Report is an in-depth analysis detailing your home's value as well as a comparison with similar homes in the area
Home Values in the Area
Average Home Value in this Area
Tax History Compared to Growth
Tax History
| Year | Tax Paid | Tax Assessment Tax Assessment Total Assessment is a certain percentage of the fair market value that is determined by local assessors to be the total taxable value of land and additions on the property. | Land | Improvement |
|---|---|---|---|---|
| 2025 | $8,525 | $138,642 | $19,249 | $119,393 |
| 2024 | $8,525 | $115,553 | $19,249 | $96,304 |
| 2023 | $3,678 | $96,294 | $19,249 | $77,045 |
| 2022 | $3,888 | $94,610 | $19,249 | $75,361 |
| 2021 | $7,469 | $87,536 | $19,249 | $68,287 |
| 2020 | $7,469 | $132,512 | $19,249 | $113,263 |
| 2019 | $6,546 | $132,512 | $19,249 | $113,263 |
| 2018 | $6,602 | $54,236 | $6,303 | $47,933 |
| 2017 | $6,465 | $52,551 | $7,063 | $45,488 |
| 2016 | $5,969 | $48,659 | $7,211 | $41,448 |
| 2015 | $3,854 | $45,056 | $7,509 | $37,547 |
| 2014 | $3,854 | $41,720 | $8,089 | $33,631 |
Source: Public Records
Map
Nearby Homes
- 4924 13th Ave
- 1240 43rd St
- 4709 New Utrecht Ave
- 4726 New Utrecht Ave
- 1358 53rd St Unit 2B
- 5313 13th Ave
- 4518 11th Ave
- 1117 51st St
- 1227 40th St
- 4409 New Utrecht Ave
- 5401 15th Ave
- 3809 12th Ave
- 1271 38th St
- 1025 45th St Unit 3F
- 1025 45th St Unit 4D
- 4906 Fort Hamilton Pkwy
- 1115 40th St
- 1553 39th St
- 1551 39th St
- 3902 Fort Hamilton Pkwy
- 1329-1331 47th St
- 1329-1331 47th St Unit 3
- 1329-1331 47th St Unit 5
- 1329-1331 47th St Unit 4
- 1329-1331 47th St Unit 1
- 1329-1331 47th St Unit 6
- 1325 47th St
- 1325 47th St Unit 3A
- 1325 47th St Unit 2B
- 1325 47th St Unit 1B
- 1325 47th St Unit 2A
- 1325 47th St Unit 1A
- 1325 47th St Unit 4A
- 1325 47th St Unit 3B
- 1325 47th St Unit 4B
- 1319 47th St
- 1315 47th St
- 1329 47th St Unit 1331
- 1329 47th St Unit 1331
- 1329 47th St Unit 1331