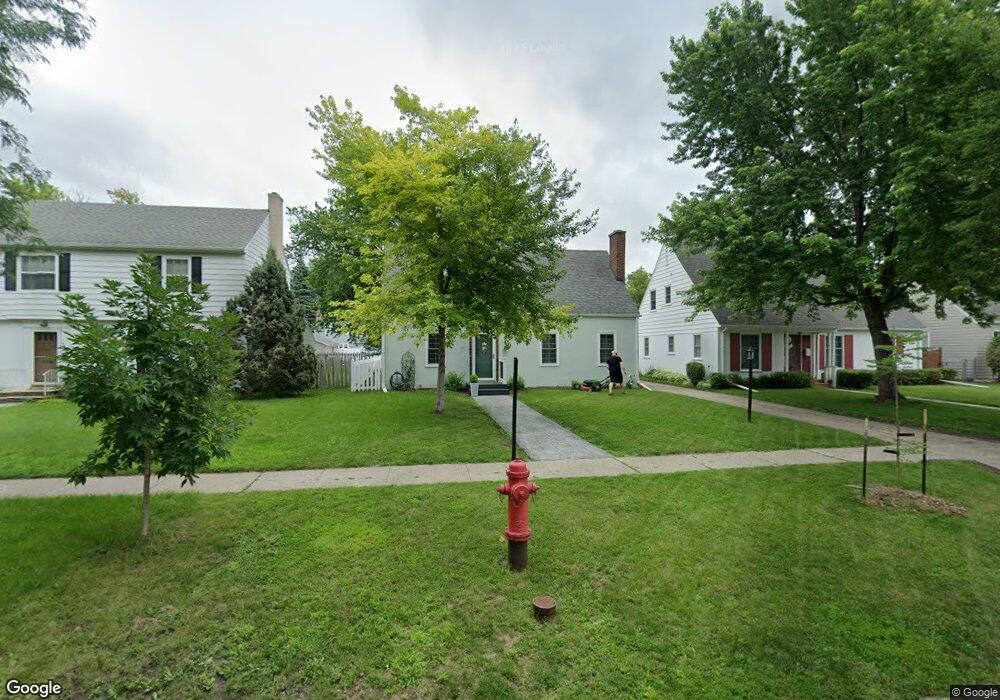
1329 3rd St N Fargo, ND 58102
Horace Mann NeighborhoodEstimated Value: $276,000 - $334,000
4
Beds
3
Baths
2,792
Sq Ft
$108/Sq Ft
Est. Value
About This Home
This home is located at 1329 3rd St N, Fargo, ND 58102 and is currently estimated at $302,644, approximately $108 per square foot. 1329 3rd St N is a home located in Cass County with nearby schools including Horace Mann Roosevelt Elementary School, Ben Franklin Middle School, and North High School.
Ownership History
Date
Name
Owned For
Owner Type
Purchase Details
Closed on
Feb 25, 2020
Sold by
Ouren Derek D and Ouren Amy C
Bought by
Bergenheier Filip Lindsay A and Filip Louis G
Current Estimated Value
Home Financials for this Owner
Home Financials are based on the most recent Mortgage that was taken out on this home.
Original Mortgage
$164,000
Outstanding Balance
$145,520
Interest Rate
3.6%
Mortgage Type
New Conventional
Estimated Equity
$157,124
Purchase Details
Closed on
Aug 15, 2013
Sold by
Meyer Nancy
Bought by
Ouren Derek D and Pedersen Amy C
Home Financials for this Owner
Home Financials are based on the most recent Mortgage that was taken out on this home.
Original Mortgage
$181,649
Interest Rate
4.12%
Mortgage Type
FHA
Create a Home Valuation Report for This Property
The Home Valuation Report is an in-depth analysis detailing your home's value as well as a comparison with similar homes in the area
Home Values in the Area
Average Home Value in this Area
Purchase History
| Date | Buyer | Sale Price | Title Company |
|---|---|---|---|
| Bergenheier Filip Lindsay A | $205,000 | Title Co | |
| Ouren Derek D | $185,000 | 6 Title Co |
Source: Public Records
Mortgage History
| Date | Status | Borrower | Loan Amount |
|---|---|---|---|
| Open | Bergenheier Filip Lindsay A | $164,000 | |
| Previous Owner | Ouren Derek D | $181,649 |
Source: Public Records
Tax History Compared to Growth
Tax History
| Year | Tax Paid | Tax Assessment Tax Assessment Total Assessment is a certain percentage of the fair market value that is determined by local assessors to be the total taxable value of land and additions on the property. | Land | Improvement |
|---|---|---|---|---|
| 2024 | $3,495 | $124,100 | $22,400 | $101,700 |
| 2023 | $3,881 | $120,500 | $22,400 | $98,100 |
| 2022 | $3,871 | $118,150 | $22,400 | $95,750 |
| 2021 | $3,602 | $110,400 | $22,400 | $88,000 |
| 2020 | $3,425 | $105,150 | $22,400 | $82,750 |
| 2019 | $3,428 | $105,150 | $12,450 | $92,700 |
| 2018 | $3,131 | $95,100 | $12,450 | $82,650 |
| 2017 | $2,988 | $90,550 | $12,450 | $78,100 |
| 2016 | $2,566 | $80,850 | $12,450 | $68,400 |
| 2015 | $2,352 | $80,850 | $9,350 | $71,500 |
| 2014 | $2,491 | $84,200 | $9,350 | $74,850 |
| 2013 | $2,499 | $84,200 | $9,350 | $74,850 |
Source: Public Records
Map
Nearby Homes