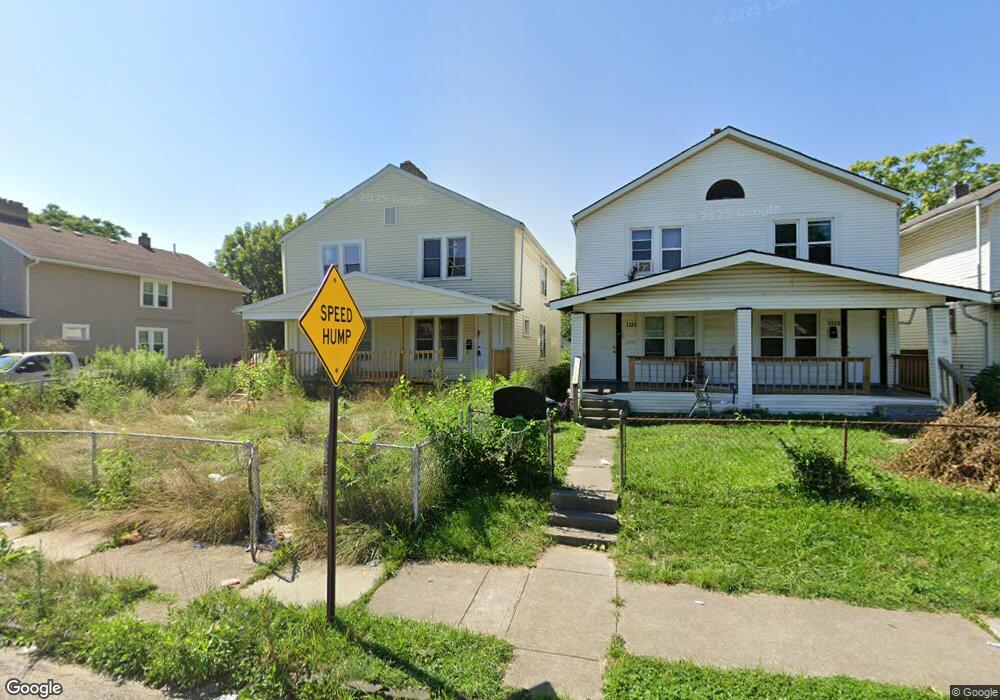
1329 E 18th Ave Unit 331 Columbus, OH 43211
South Linden NeighborhoodEstimated Value: $121,000 - $200,000
6
Beds
2
Baths
2,240
Sq Ft
$76/Sq Ft
Est. Value
About This Home
This home is located at 1329 E 18th Ave Unit 331, Columbus, OH 43211 and is currently estimated at $169,628, approximately $75 per square foot. 1329 E 18th Ave Unit 331 is a home located in Franklin County with nearby schools including Windsor Stem Acadmey, Linden-Mckinley Stem School On Arcadia, and North Columbus Preparatory Academy.
Ownership History
Date
Name
Owned For
Owner Type
Purchase Details
Closed on
Jan 23, 2012
Sold by
Roberts Michelle L and Roberts Jeremy A
Bought by
Rts Enterprises Llc
Current Estimated Value
Purchase Details
Closed on
Nov 1, 2011
Sold by
Hudecek G
Bought by
Roberts Michelle L
Purchase Details
Closed on
Dec 2, 2009
Sold by
Sherman Felicia and Sherman Tim
Bought by
Hudecek G
Purchase Details
Closed on
Aug 7, 2008
Sold by
Harden Josephine
Bought by
Sherman Felicia
Purchase Details
Closed on
Feb 25, 2008
Sold by
Harden Jermaine and Hardew Lakisha M
Bought by
Harden Josephine
Purchase Details
Closed on
Nov 9, 2007
Sold by
Harden Josephine
Bought by
Harden Jermaine
Purchase Details
Closed on
Jul 20, 2005
Sold by
Estate Of Naomi Harden
Bought by
Harden Josephine
Purchase Details
Closed on
Dec 8, 1980
Bought by
Harden Naomi
Create a Home Valuation Report for This Property
The Home Valuation Report is an in-depth analysis detailing your home's value as well as a comparison with similar homes in the area
Home Values in the Area
Average Home Value in this Area
Purchase History
We collect this data history from publicly available records. To have your information removed, we recommend requesting removal directly through your county’s website.
| Date | Buyer | Sale Price | Title Company |
|---|---|---|---|
| Rts Enterprises Llc | $45,300 | Attorney | |
| Roberts Michelle L | -- | None Available | |
| Hudecek G | $12,000 | None Available | |
| Sherman Felicia | $10,000 | Premiere | |
| Harden Josephine | -- | Attorney | |
| Harden Jermaine | $71,800 | Attorney | |
| Harden Josephine | -- | -- | |
| Harden Naomi | -- | -- |
Source: Public Records
Tax History
| Year | Tax Paid | Tax Assessment Tax Assessment Total Assessment is a certain percentage of the fair market value that is determined by local assessors to be the total taxable value of land and additions on the property. | Land | Improvement |
|---|---|---|---|---|
| 2025 | $2,534 | $46,980 | $5,920 | $41,060 |
| 2024 | $2,534 | $46,980 | $5,920 | $41,060 |
| 2023 | $2,780 | $46,970 | $5,915 | $41,055 |
| 2022 | $1,153 | $21,700 | $2,450 | $19,250 |
| 2021 | $1,155 | $21,700 | $2,450 | $19,250 |
| 2020 | $1,157 | $21,700 | $2,450 | $19,250 |
| 2019 | $1,126 | $18,100 | $2,030 | $16,070 |
| 2018 | $1,090 | $18,100 | $2,030 | $16,070 |
| 2017 | $1,125 | $18,100 | $2,030 | $16,070 |
| 2016 | $1,160 | $17,080 | $2,660 | $14,420 |
| 2015 | $1,056 | $17,080 | $2,660 | $14,420 |
| 2014 | $1,059 | $17,080 | $2,660 | $14,420 |
| 2013 | $580 | $18,970 | $2,940 | $16,030 |
Source: Public Records
Map
Nearby Homes
- 1315 E 18th Ave
- 1369-1371 E 18th Ave
- 1363 E 19th Ave
- 1433 E 19th Ave
- 1249-1251 E 15th Ave
- 1673 Cleveland Ave
- 1157-1159 E 18th Ave
- 1386 E 22nd Ave
- 1303 E 22nd Ave
- 1129 E 17th Ave
- 1265 E 22nd Ave
- 0 Windsor Ave
- 1371 E 23rd Ave
- 1111-1113 E 16th Ave
- 1133 E 19th Ave
- 1266 E 22nd Ave
- 1384 E 23rd Ave
- 1251 E 23rd Ave
- 1070 E 16th Ave
- 1074 E 15th Ave
- 1329-1331 E 18th Ave
- 1325 E 18th Ave Unit 327
- 1333 E 18th Ave Unit 335
- 1333-1335 E 18th Ave
- 1323 E 18th Ave Unit 27
- 1323 E 18th Ave
- 1323 E 18th Ave Unit 1325
- 1321 E 18th Ave Unit 323
- 1337 E 18th Ave
- 1337 E 18th Ave Unit 339
- 1335 E 18th Ave
- 1319 E 18th Ave
- 1317 E 18th Ave Unit 319
- 1343 E 18th Ave Unit 345
- 1343-1345 E 18th Ave Unit 2
- 1347 E 18th Ave Unit 349
- 1347-1349 E 18th Ave
- 1320 E 17th Ave Unit 322
- 1320-1322 E 17th Ave
- 1320-1322 E 17th Ave Unit 322
Your Personal Tour Guide
Ask me questions while you tour the home.