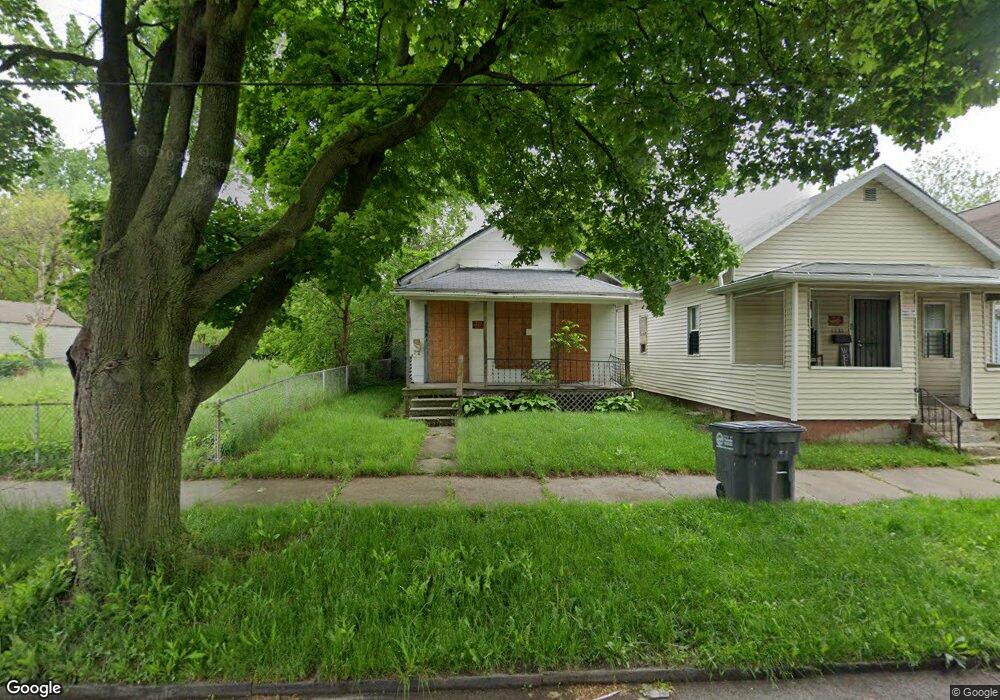
1329 Peck St Toledo, OH 43608
Lagrange NeighborhoodEstimated Value: $16,533 - $62,000
2
Beds
1
Bath
760
Sq Ft
$52/Sq Ft
Est. Value
About This Home
This home is located at 1329 Peck St, Toledo, OH 43608 and is currently estimated at $39,267, approximately $51 per square foot. 1329 Peck St is a home located in Lucas County with nearby schools including Spring Elementary School, Woodward High School, and Imagine Environmental Science Academy.
Ownership History
Date
Name
Owned For
Owner Type
Purchase Details
Closed on
Mar 31, 2020
Sold by
Johnson Dorian John
Bought by
Johnson Steven D
Current Estimated Value
Purchase Details
Closed on
Apr 23, 2018
Sold by
Johnson Terrance D
Bought by
Johnson Dorian John
Purchase Details
Closed on
Jun 27, 2017
Sold by
Harris Ronald and Harris Rochelle
Bought by
Johnson Terrance D
Purchase Details
Closed on
Apr 1, 2016
Sold by
Randall Lora R
Bought by
Goodlow Ronald L
Purchase Details
Closed on
Jun 28, 2000
Sold by
Harrigan Harrigan W and Harrigan S M
Bought by
Randall Lora R
Create a Home Valuation Report for This Property
The Home Valuation Report is an in-depth analysis detailing your home's value as well as a comparison with similar homes in the area
Home Values in the Area
Average Home Value in this Area
Purchase History
| Date | Buyer | Sale Price | Title Company |
|---|---|---|---|
| Johnson Steven D | $2,000 | None Available | |
| Johnson Dorian John | $1,000 | None Available | |
| Johnson Terrance D | -- | None Available | |
| Goodlow Ronald L | $300 | None Available | |
| Randall Lora R | $12,500 | -- |
Source: Public Records
Tax History Compared to Growth
Tax History
| Year | Tax Paid | Tax Assessment Tax Assessment Total Assessment is a certain percentage of the fair market value that is determined by local assessors to be the total taxable value of land and additions on the property. | Land | Improvement |
|---|---|---|---|---|
| 2024 | $10,268 | $140 | $140 | -- |
| 2023 | $262 | $2,100 | $1,295 | $805 |
| 2022 | $7,162 | $4,620 | $1,295 | $3,325 |
| 2021 | $415 | $4,620 | $1,295 | $3,325 |
| 2020 | $439 | $4,410 | $1,365 | $3,045 |
| 2019 | $441 | $4,410 | $1,365 | $3,045 |
| 2018 | $431 | $4,410 | $1,365 | $3,045 |
| 2017 | $4,851 | $4,305 | $1,330 | $2,975 |
| 2016 | $3,895 | $12,300 | $3,800 | $8,500 |
| 2015 | $434 | $12,300 | $3,800 | $8,500 |
| 2014 | $418 | $4,310 | $1,330 | $2,980 |
| 2013 | $279 | $4,310 | $1,330 | $2,980 |
Source: Public Records
Map
Nearby Homes