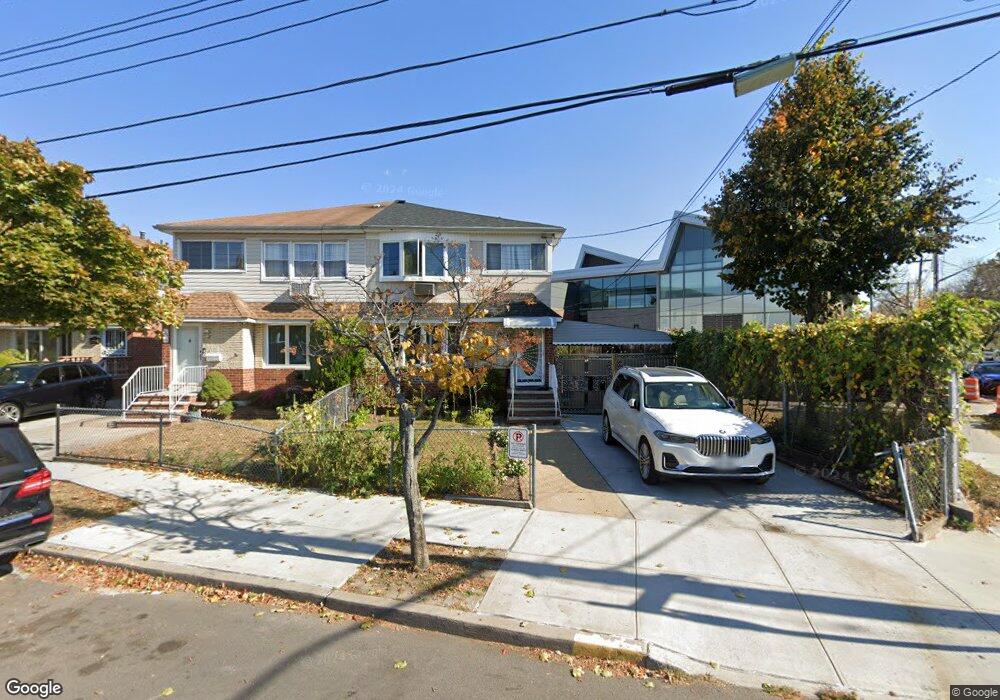
133-47 88th St Ozone Park, NY 11417
Ozone Park NeighborhoodEstimated Value: $1,003,000 - $1,190,000
6
Beds
5
Baths
2,120
Sq Ft
$516/Sq Ft
Est. Value
About This Home
This home is located at 133-47 88th St, Ozone Park, NY 11417 and is currently estimated at $1,093,457, approximately $515 per square foot. 133-47 88th St is a home located in Queens County with nearby schools including P.S. 63 - Old South, Robert H. Goddard High School, and Our World Neighborhood Charter School 2.
Ownership History
Date
Name
Owned For
Owner Type
Purchase Details
Closed on
Dec 30, 2015
Sold by
Mahamud Mahatab U and Uddin Mohin
Bought by
Mahamud Mahatab U
Current Estimated Value
Home Financials for this Owner
Home Financials are based on the most recent Mortgage that was taken out on this home.
Original Mortgage
$458,000
Outstanding Balance
$364,495
Interest Rate
3.98%
Mortgage Type
Purchase Money Mortgage
Estimated Equity
$728,962
Purchase Details
Closed on
Sep 12, 2014
Sold by
Litwack Referee Lawrence M
Bought by
Mahamud Mahatab U and Uddin Mohin
Home Financials for this Owner
Home Financials are based on the most recent Mortgage that was taken out on this home.
Original Mortgage
$439,200
Interest Rate
4.18%
Mortgage Type
New Conventional
Purchase Details
Closed on
Jul 23, 1986
Sold by
Sannuto Anthony
Bought by
Delio Richard A and Delio Rose L
Create a Home Valuation Report for This Property
The Home Valuation Report is an in-depth analysis detailing your home's value as well as a comparison with similar homes in the area
Home Values in the Area
Average Home Value in this Area
Purchase History
| Date | Buyer | Sale Price | Title Company |
|---|---|---|---|
| Mahamud Mahatab U | -- | -- | |
| Mahamud Mahatab U | $549,000 | -- | |
| Delio Richard A | -- | -- |
Source: Public Records
Mortgage History
| Date | Status | Borrower | Loan Amount |
|---|---|---|---|
| Open | Mahamud Mahatab U | $458,000 | |
| Previous Owner | Mahamud Mahatab U | $439,200 |
Source: Public Records
Tax History Compared to Growth
Tax History
| Year | Tax Paid | Tax Assessment Tax Assessment Total Assessment is a certain percentage of the fair market value that is determined by local assessors to be the total taxable value of land and additions on the property. | Land | Improvement |
|---|---|---|---|---|
| 2025 | $9,213 | $48,619 | $15,539 | $33,080 |
| 2024 | $9,213 | $45,868 | $15,761 | $30,107 |
| 2023 | $8,691 | $43,272 | $14,962 | $28,310 |
| 2022 | $8,638 | $60,900 | $20,040 | $40,860 |
| 2021 | $9,038 | $50,460 | $20,040 | $30,420 |
| 2020 | $8,576 | $43,380 | $20,040 | $23,340 |
| 2019 | $7,996 | $42,060 | $20,040 | $22,020 |
| 2018 | $7,351 | $36,060 | $20,040 | $16,020 |
| 2017 | $7,794 | $38,232 | $18,779 | $19,453 |
| 2016 | $7,585 | $38,232 | $18,779 | $19,453 |
| 2015 | $4,310 | $35,797 | $19,445 | $16,352 |
| 2014 | $4,310 | $33,771 | $22,019 | $11,752 |
Source: Public Records
Map
Nearby Homes
- 8837 Pitkin Ave
- 8851 Pitkin Ave
- 8812 Albert Rd
- 132-18 89th St
- 133-42 86th St
- 91-25 Gold Rd
- 84-07 Sutter Ave
- 13723 Lafayette St
- 9108 Sutter Ave
- 10751 89th St
- 10766 92nd St
- 107-50 90th St
- 8509 Sutter Ave
- 9003 Albert Rd
- 13319 Crossbay Blvd
- 132-36 84th St
- 84-11 Sutter Ave
- 87-10 149th Ave Unit 5D
- 107-62 93rd St
- 10724 87th St
- 13331 88th St
- 13331 88th St
- 13331 88th St
- 13331 88th St Unit 2nd Fl
- 13335 88th St
- 133-35 88th St
- 13339 88th St
- 13343 88th St
- 13330 88th St
- 133-43 88th St
- 13332 88th St
- 88-25 Pitkin Ave
- 8825 Pitkin Ave
- 13334 88th St
- 8821 Pitkin Ave
- 8827 Pitkin Ave
- 13338 88th St
- 8831 Pitkin Ave
- 8817 Pitkin Ave
- 8829 Pitkin Ave