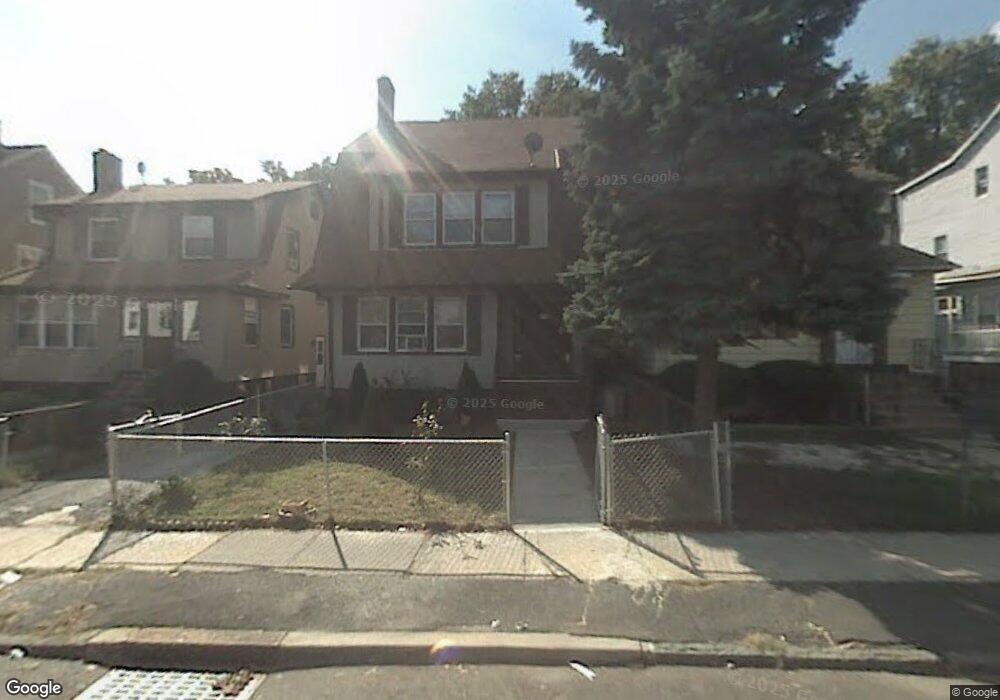
133 4th Ave East Orange, NJ 07017
Estimated Value: $527,000 - $661,000
--
Bed
--
Bath
3,104
Sq Ft
$183/Sq Ft
Est. Value
About This Home
This home is located at 133 4th Ave, East Orange, NJ 07017 and is currently estimated at $566,878, approximately $182 per square foot. 133 4th Ave is a home located in Essex County with nearby schools including Gordon Parks Academy Elementary School, John L Costley Middle School, and Patrick F Healy Middle School.
Ownership History
Date
Name
Owned For
Owner Type
Purchase Details
Closed on
Nov 4, 2005
Sold by
Braimah Adamu
Bought by
Ortega Ruth
Current Estimated Value
Home Financials for this Owner
Home Financials are based on the most recent Mortgage that was taken out on this home.
Original Mortgage
$222,360
Outstanding Balance
$121,015
Interest Rate
5.93%
Mortgage Type
New Conventional
Estimated Equity
$445,863
Purchase Details
Closed on
Jun 30, 1994
Sold by
Crayne Annie
Bought by
Braimah Adamu
Home Financials for this Owner
Home Financials are based on the most recent Mortgage that was taken out on this home.
Original Mortgage
$99,000
Interest Rate
8.25%
Mortgage Type
FHA
Purchase Details
Closed on
Jun 16, 1994
Sold by
Veterans Affairs
Bought by
Crayne Annie
Home Financials for this Owner
Home Financials are based on the most recent Mortgage that was taken out on this home.
Original Mortgage
$99,000
Interest Rate
8.25%
Mortgage Type
FHA
Create a Home Valuation Report for This Property
The Home Valuation Report is an in-depth analysis detailing your home's value as well as a comparison with similar homes in the area
Home Values in the Area
Average Home Value in this Area
Purchase History
| Date | Buyer | Sale Price | Title Company |
|---|---|---|---|
| Ortega Ruth | $277,950 | -- | |
| -- | $278,000 | -- | |
| Braimah Adamu | $65,000 | -- | |
| Crayne Annie | $35,000 | -- |
Source: Public Records
Mortgage History
| Date | Status | Borrower | Loan Amount |
|---|---|---|---|
| Open | -- | $222,360 | |
| Previous Owner | Braimah Adamu | $99,000 |
Source: Public Records
Tax History Compared to Growth
Tax History
| Year | Tax Paid | Tax Assessment Tax Assessment Total Assessment is a certain percentage of the fair market value that is determined by local assessors to be the total taxable value of land and additions on the property. | Land | Improvement |
|---|---|---|---|---|
| 2025 | $12,276 | $387,500 | $68,600 | $318,900 |
| 2024 | $12,276 | $387,500 | $68,600 | $318,900 |
| 2022 | $11,261 | $387,500 | $68,600 | $318,900 |
| 2021 | $13,819 | $249,400 | $58,300 | $191,100 |
| 2020 | $13,642 | $249,400 | $58,300 | $191,100 |
| 2019 | $13,468 | $249,400 | $58,300 | $191,100 |
| 2018 | $13,301 | $249,400 | $58,300 | $191,100 |
| 2017 | $12,929 | $249,400 | $58,300 | $191,100 |
| 2016 | $12,727 | $249,400 | $58,300 | $191,100 |
| 2015 | $12,415 | $249,400 | $58,300 | $191,100 |
| 2014 | $12,241 | $249,400 | $58,300 | $191,100 |
Source: Public Records
Map
Nearby Homes
- 11 N 21st St
- 122 4th Ave
- 165 4th Ave
- 5 N 22nd St
- 45 Warrington Place
- 182 N 19th St
- 182 N 19th St Unit 3
- 191 N 17th St
- 341 N Grove St
- 158 N 18th St
- 321 N Grove St
- 312 N Maple Ave Unit 2
- 63 Stockton Place
- 187 Rutledge Ave
- 38 Hoffman Blvd
- 337 N Maple Ave
- 287 N Maple Ave
- 176 N 16th St
- 58 Park Ave
- 508 N Grove St