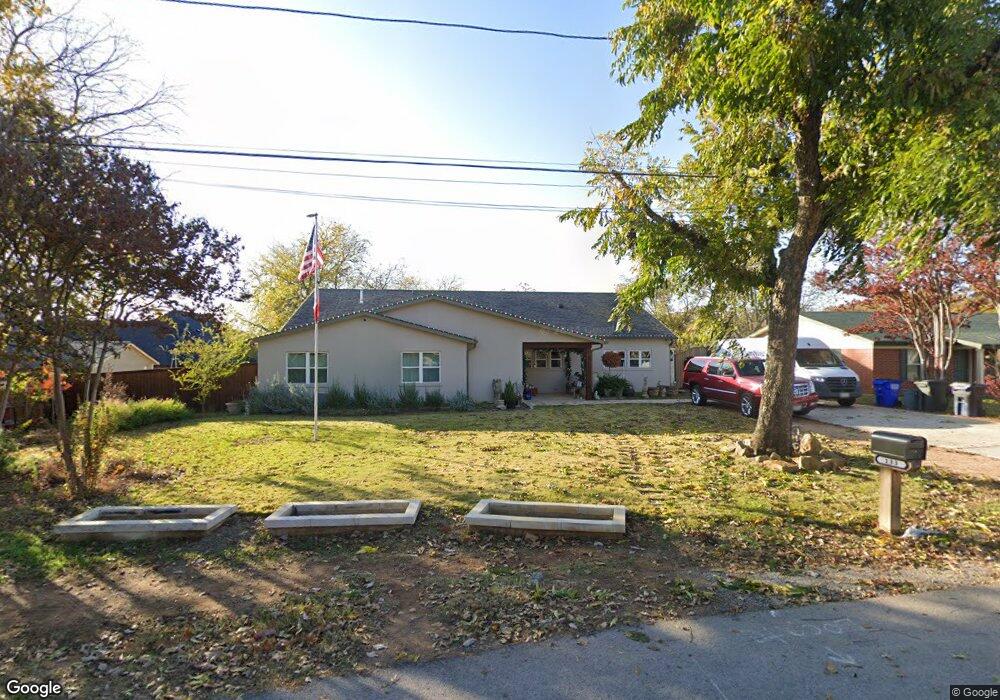
133 Acuff Ln Colleyville, TX 76034
Estimated Value: $769,824 - $1,470,000
3
Beds
1
Bath
3,536
Sq Ft
$272/Sq Ft
Est. Value
About This Home
This home is located at 133 Acuff Ln, Colleyville, TX 76034 and is currently estimated at $960,706, approximately $271 per square foot. 133 Acuff Ln is a home located in Tarrant County with nearby schools including Bransford Elementary School, Colleyville Middle School, and Grapevine High School.
Ownership History
Date
Name
Owned For
Owner Type
Purchase Details
Closed on
Feb 27, 2017
Sold by
Moore Joe and Moore Peggy
Bought by
Laprelle Chad
Current Estimated Value
Home Financials for this Owner
Home Financials are based on the most recent Mortgage that was taken out on this home.
Original Mortgage
$180,000
Outstanding Balance
$149,596
Interest Rate
4.25%
Mortgage Type
Adjustable Rate Mortgage/ARM
Estimated Equity
$811,110
Purchase Details
Closed on
Aug 5, 1998
Sold by
Brown Billy Lee
Bought by
Moore Joe and Moore Peggy
Home Financials for this Owner
Home Financials are based on the most recent Mortgage that was taken out on this home.
Original Mortgage
$57,000
Interest Rate
6.94%
Mortgage Type
Seller Take Back
Create a Home Valuation Report for This Property
The Home Valuation Report is an in-depth analysis detailing your home's value as well as a comparison with similar homes in the area
Home Values in the Area
Average Home Value in this Area
Purchase History
| Date | Buyer | Sale Price | Title Company |
|---|---|---|---|
| Laprelle Chad | -- | None Available | |
| Moore Joe | -- | Stewart Title North Texas In |
Source: Public Records
Mortgage History
| Date | Status | Borrower | Loan Amount |
|---|---|---|---|
| Open | Laprelle Chad | $180,000 | |
| Previous Owner | Moore Joe | $57,000 |
Source: Public Records
Tax History Compared to Growth
Tax History
| Year | Tax Paid | Tax Assessment Tax Assessment Total Assessment is a certain percentage of the fair market value that is determined by local assessors to be the total taxable value of land and additions on the property. | Land | Improvement |
|---|---|---|---|---|
| 2025 | $2,709 | $761,681 | $275,545 | $486,136 |
| 2024 | $2,709 | $761,681 | $275,545 | $486,136 |
| 2023 | $5,062 | $372,996 | $275,545 | $97,451 |
| 2022 | $5,388 | $349,403 | $275,545 | $73,858 |
| 2021 | $5,446 | $248,000 | $201,090 | $46,910 |
| 2020 | $5,511 | $248,000 | $201,090 | $46,910 |
| 2019 | $5,734 | $248,000 | $201,090 | $46,910 |
| 2018 | $1,572 | $264,469 | $201,090 | $63,379 |
| 2017 | $1,847 | $251,593 | $201,090 | $50,503 |
| 2016 | $1,679 | $247,491 | $198,090 | $49,401 |
| 2015 | $1,299 | $64,600 | $25,000 | $39,600 |
| 2014 | $1,299 | $64,600 | $25,000 | $39,600 |
Source: Public Records
Map
Nearby Homes
- 3713 Brentwood Ct
- 405 Woodbriar Ct
- 2732 Woodbridge Dr
- 628 Huntwich Dr
- 312 Bremen Dr
- 4600 Bransford Rd
- 405 Bremen Dr
- 2620 Brookridge Dr
- 305 Warbler Dr
- 2852 Winterhaven Dr
- 909 Brestol Ct W
- 3605 Spring Valley Dr
- 2844 Hurstview Dr
- 4105 Inwood Ln
- 320 Blue Quail Ct
- 114 Glade Rd
- 3624 Wayne Ct
- 3609 Wayne Ct
- 2809 Sandstone Dr
- 112 Glade Rd