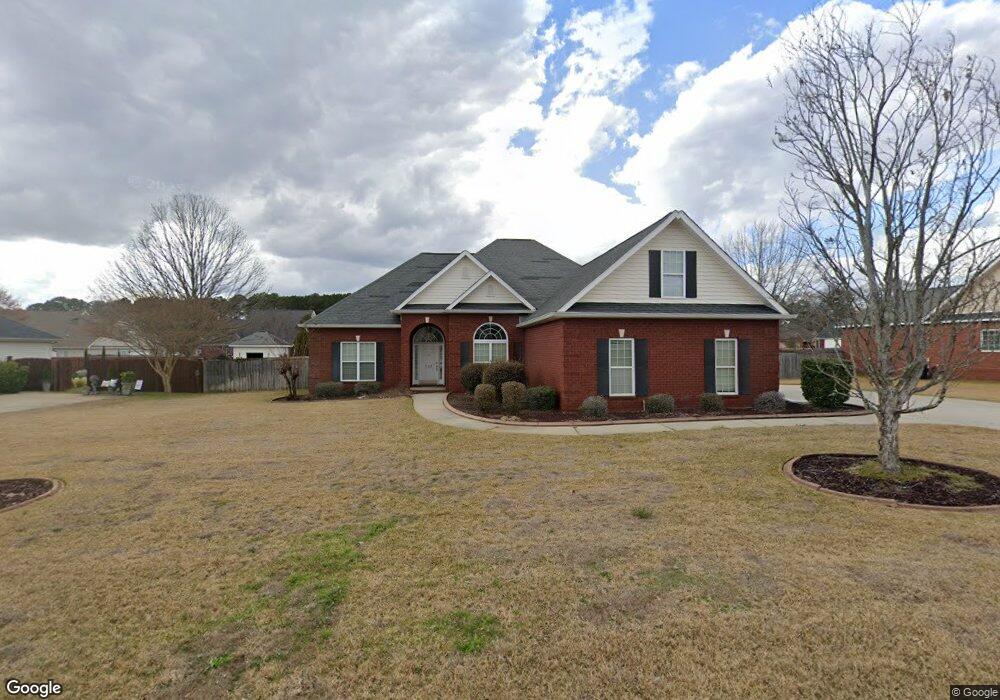
133 Addington Dr Warner Robins, GA 31088
Estimated Value: $316,000 - $349,000
3
Beds
3
Baths
1,881
Sq Ft
$175/Sq Ft
Est. Value
About This Home
This home is located at 133 Addington Dr, Warner Robins, GA 31088 and is currently estimated at $328,885, approximately $174 per square foot. 133 Addington Dr is a home located in Houston County with nearby schools including David A. Perdue Primary School, David A. Perdue Elementary School, and Mossy Creek Middle School.
Ownership History
Date
Name
Owned For
Owner Type
Purchase Details
Closed on
Oct 6, 2023
Sold by
Akins Robert M
Bought by
Singh Roy Rishneel and Gandhi Rajesh Kumar
Current Estimated Value
Home Financials for this Owner
Home Financials are based on the most recent Mortgage that was taken out on this home.
Original Mortgage
$265,500
Outstanding Balance
$260,338
Interest Rate
7.18%
Mortgage Type
New Conventional
Estimated Equity
$68,547
Purchase Details
Closed on
Jan 22, 2016
Sold by
Cason Justin
Bought by
Akins Robert M
Home Financials for this Owner
Home Financials are based on the most recent Mortgage that was taken out on this home.
Original Mortgage
$177,152
Interest Rate
3.98%
Mortgage Type
VA
Purchase Details
Closed on
Oct 17, 2006
Sold by
The Bank Of Perry
Bought by
Selphs Co Inc
Purchase Details
Closed on
Jun 21, 2005
Sold by
Peter Black Settlement Corp
Bought by
Mike Carter Home Builders & Remodeling
Create a Home Valuation Report for This Property
The Home Valuation Report is an in-depth analysis detailing your home's value as well as a comparison with similar homes in the area
Home Values in the Area
Average Home Value in this Area
Purchase History
| Date | Buyer | Sale Price | Title Company |
|---|---|---|---|
| Singh Roy Rishneel | $295,000 | None Listed On Document | |
| Akins Robert M | $173,000 | -- | |
| Selphs Co Inc | -- | None Available | |
| Mike Carter Home Builders & Remodeling | $31,500 | -- |
Source: Public Records
Mortgage History
| Date | Status | Borrower | Loan Amount |
|---|---|---|---|
| Open | Singh Roy Rishneel | $265,500 | |
| Previous Owner | Akins Robert M | $177,152 |
Source: Public Records
Tax History Compared to Growth
Tax History
| Year | Tax Paid | Tax Assessment Tax Assessment Total Assessment is a certain percentage of the fair market value that is determined by local assessors to be the total taxable value of land and additions on the property. | Land | Improvement |
|---|---|---|---|---|
| 2024 | $2,782 | $116,280 | $16,000 | $100,280 |
| 2023 | $2,192 | $90,680 | $16,000 | $74,680 |
| 2022 | $2,160 | $89,360 | $16,000 | $73,360 |
| 2021 | $2,013 | $82,840 | $16,000 | $66,840 |
| 2020 | $1,915 | $78,440 | $16,000 | $62,440 |
| 2019 | $1,915 | $78,440 | $16,000 | $62,440 |
| 2018 | $1,915 | $78,440 | $16,000 | $62,440 |
| 2017 | $1,691 | $73,400 | $13,200 | $60,200 |
| 2016 | $1,692 | $71,160 | $13,200 | $57,960 |
| 2015 | $1,709 | $71,680 | $13,200 | $58,480 |
| 2014 | -- | $71,680 | $13,200 | $58,480 |
| 2013 | -- | $71,680 | $13,200 | $58,480 |
Source: Public Records
Map
Nearby Homes
- 251 Hathersage Dr
- 114 Addington Dr
- 250 Hathersage Dr
- 312 Cambrian Dr
- 106 Paradise Ct
- 118 Sycamore Rd
- 2636 Us Highway 41
- 94 Sweet Bay Rd
- 107 Whitney Ct
- 300 Brantley Ridge
- 103 Lawing Place
- 2327 Us Hwy 41
- 2327 U S 41
- 103 Waldorf Dr
- 313 Ruger Place
- 601 Hunt's Landing Dr
- 203 Weatherwood Rd
- 201 Boulder Creek Rd
- 133 Addington Dr
- 131 Addington Dr
- 135 Addington Dr
- 234 Hathersage Dr
- 232 Hathersage Dr
- 132 Addington Dr
- 129 Addington Dr
- 130 Addington Dr
- 134 Addington Dr
- 236 Hathersage Dr
- 230 Hathersage Dr
- 137 Addington Dr
- 128 Addington Dr
- 136 Addington Dr
- 127 Addington Dr
- 238 Hathersage Dr
- 331 Cambrian Dr Unit 56 C
- 331 Cambrian Dr
- 329 Cambrian Dr Unit 57C
- 329 Cambrian Dr