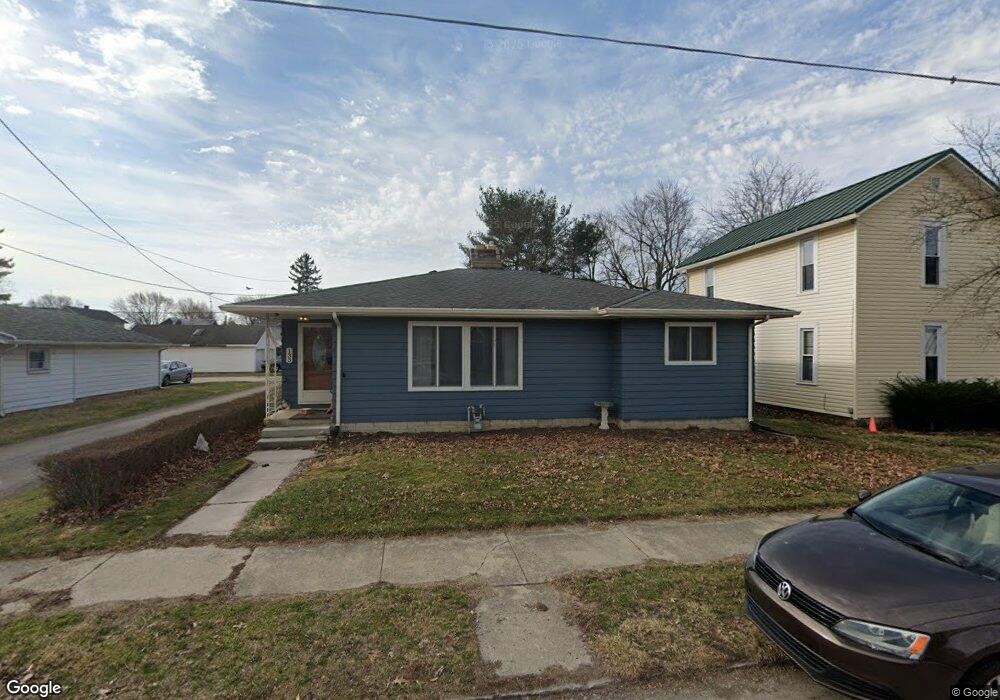
133 Allen Ave Findlay, OH 45840
Estimated Value: $157,000 - $176,000
2
Beds
1
Bath
1,279
Sq Ft
$129/Sq Ft
Est. Value
About This Home
This home is located at 133 Allen Ave, Findlay, OH 45840 and is currently estimated at $165,410, approximately $129 per square foot. 133 Allen Ave is a home located in Hancock County with nearby schools including Whittier Primary School, Bigelow Hill Elementary School, and Glenwood Middle School.
Ownership History
Date
Name
Owned For
Owner Type
Purchase Details
Closed on
May 13, 2024
Sold by
Byrd Edward Toby and Byrd Deborah A
Bought by
Byrd Jonathan Allan
Current Estimated Value
Purchase Details
Closed on
Jul 24, 2015
Bought by
Byrd Toby E and Byrd Deborah A
Home Financials for this Owner
Home Financials are based on the most recent Mortgage that was taken out on this home.
Interest Rate
4.04%
Create a Home Valuation Report for This Property
The Home Valuation Report is an in-depth analysis detailing your home's value as well as a comparison with similar homes in the area
Home Values in the Area
Average Home Value in this Area
Purchase History
| Date | Buyer | Sale Price | Title Company |
|---|---|---|---|
| Byrd Jonathan Allan | -- | None Listed On Document | |
| Byrd Toby E | -- | -- |
Source: Public Records
Mortgage History
| Date | Status | Borrower | Loan Amount |
|---|---|---|---|
| Previous Owner | Byrd Toby E | -- |
Source: Public Records
Tax History Compared to Growth
Tax History
| Year | Tax Paid | Tax Assessment Tax Assessment Total Assessment is a certain percentage of the fair market value that is determined by local assessors to be the total taxable value of land and additions on the property. | Land | Improvement |
|---|---|---|---|---|
| 2024 | $1,501 | $42,240 | $3,970 | $38,270 |
| 2023 | $1,542 | $42,240 | $3,970 | $38,270 |
| 2022 | $1,537 | $42,240 | $3,970 | $38,270 |
| 2021 | $1,463 | $35,020 | $3,990 | $31,030 |
| 2020 | $1,463 | $35,020 | $3,990 | $31,030 |
| 2019 | $1,434 | $35,020 | $3,990 | $31,030 |
| 2018 | $1,286 | $28,820 | $3,620 | $25,200 |
| 2017 | $643 | $28,820 | $3,620 | $25,200 |
| 2016 | $1,277 | $28,820 | $3,620 | $25,200 |
| 2015 | $1,469 | $32,670 | $3,960 | $28,710 |
| 2014 | $1,047 | $32,670 | $3,960 | $28,710 |
| 2012 | $1,055 | $32,670 | $3,960 | $28,710 |
Source: Public Records
Map
Nearby Homes
- 206 Midland Ave
- 230 Midland Ave
- 115 George St
- 334 E Foulke Ave
- 420 Allen Ave
- 207 Ash Ave
- 247 Crystal Ave
- 706 N Cory St
- 1825 Pershing St
- 1820 N Main St
- 224 Defiance Ave
- 410 Monroe Ave
- 715 Christina Ct
- 405 Clifton Ave
- 533 Davis St
- 1934 Geffs Ave
- 304 Rector Ave
- 604 Davis St
- 512 N Cory St
- 524 Defiance Ave