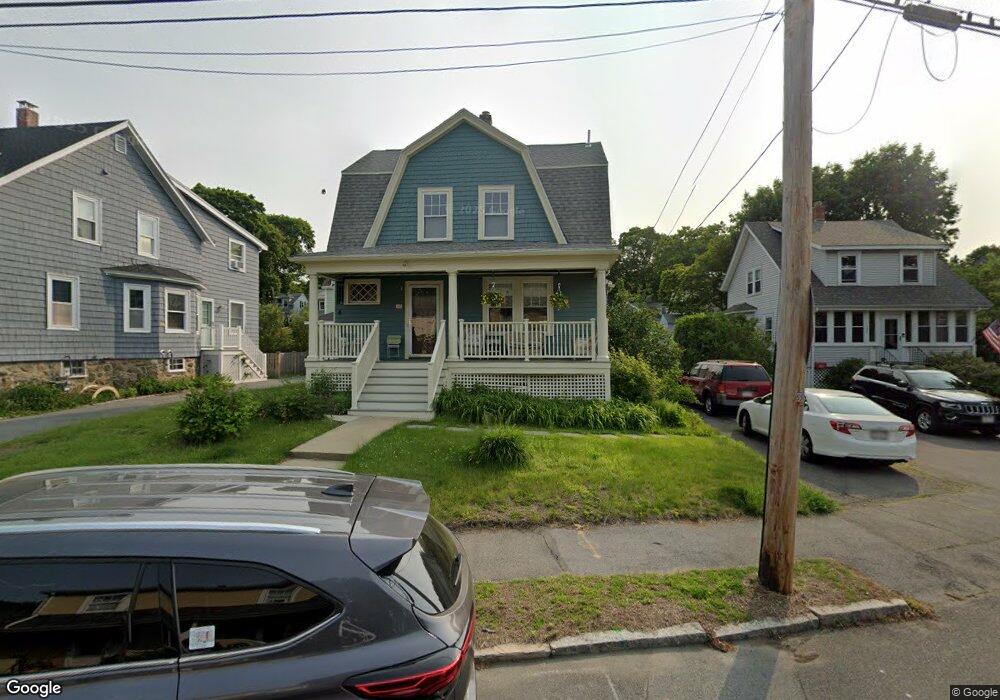
133 Aspen Rd Swampscott, MA 01907
Estimated Value: $795,000 - $961,000
3
Beds
3
Baths
1,616
Sq Ft
$537/Sq Ft
Est. Value
About This Home
This home is located at 133 Aspen Rd, Swampscott, MA 01907 and is currently estimated at $868,428, approximately $537 per square foot. 133 Aspen Rd is a home located in Essex County with nearby schools including Swampscott Middle School and Swampscott High School.
Ownership History
Date
Name
Owned For
Owner Type
Purchase Details
Closed on
Oct 19, 2021
Sold by
Crossman Antony H and Sharon-Medoff Jeslyn
Bought by
Jeslyn S Medoff T S and Jeslyn Crossman
Current Estimated Value
Purchase Details
Closed on
Jun 17, 1994
Sold by
Chapman Fred J Est
Bought by
Crossman Anthony and Medoff Jeslyn
Create a Home Valuation Report for This Property
The Home Valuation Report is an in-depth analysis detailing your home's value as well as a comparison with similar homes in the area
Home Values in the Area
Average Home Value in this Area
Purchase History
| Date | Buyer | Sale Price | Title Company |
|---|---|---|---|
| Jeslyn S Medoff T S | -- | None Available | |
| Jeslyn S Medoff T | -- | None Available | |
| Jeslyn S Medoff T S | -- | None Available | |
| Crossman Anthony | $160,000 | -- | |
| Crossman Anthony | $160,000 | -- |
Source: Public Records
Mortgage History
| Date | Status | Borrower | Loan Amount |
|---|---|---|---|
| Previous Owner | Crossman Anthony | $334,400 | |
| Previous Owner | Crossman Anthony | $350,000 |
Source: Public Records
Tax History Compared to Growth
Tax History
| Year | Tax Paid | Tax Assessment Tax Assessment Total Assessment is a certain percentage of the fair market value that is determined by local assessors to be the total taxable value of land and additions on the property. | Land | Improvement |
|---|---|---|---|---|
| 2025 | $8,898 | $775,800 | $331,400 | $444,400 |
| 2024 | $8,577 | $746,500 | $315,200 | $431,300 |
| 2023 | $7,836 | $667,500 | $282,900 | $384,600 |
| 2022 | $7,368 | $574,300 | $242,500 | $331,800 |
| 2021 | $7,318 | $530,300 | $226,300 | $304,000 |
| 2020 | $7,177 | $501,900 | $202,100 | $299,800 |
| 2019 | $7,256 | $477,400 | $181,900 | $295,500 |
| 2018 | $7,208 | $450,500 | $165,700 | $284,800 |
| 2017 | $7,380 | $422,900 | $155,200 | $267,700 |
| 2016 | $7,329 | $422,900 | $155,200 | $267,700 |
| 2015 | $7,253 | $422,900 | $155,200 | $267,700 |
| 2014 | $6,582 | $352,000 | $129,300 | $222,700 |
Source: Public Records
Map
Nearby Homes
- 75 Bay View Dr
- 8 Ocean View Rd
- 13 Cedar Hill Terrace Unit 2
- 21 Bay View Dr
- 71 Walnut Rd
- 71 Greenwood Ave Unit 207
- 309 Paradise Rd
- 140 Elmwood Rd
- 306 Paradise Rd
- 24 Orchard Cir
- 35 Alden Rd
- 98 Paradise Rd
- 51 Barnstable St
- 76 Stetson Ave
- 30 Paradise Rd
- 106 Norfolk Ave
- 28 Claremont Terrace Unit 4
- 28 Claremont Terrace Unit 6
- 10-12 Fairview Ave
- 110 Galloupes Point Rd