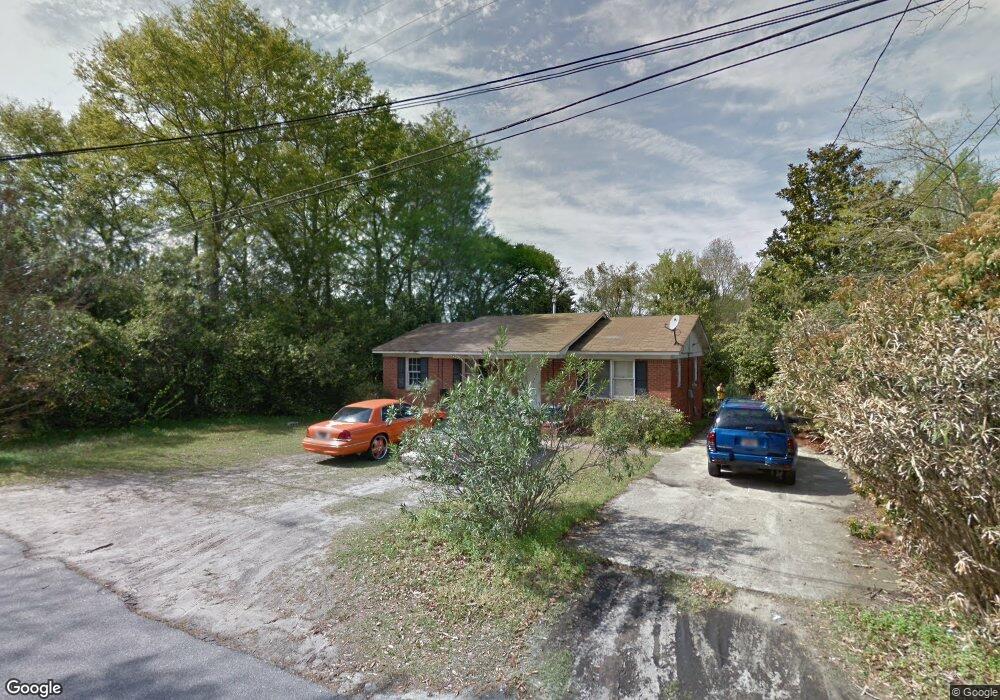
133 Carver St Sumter, SC 29150
Birnie NeighborhoodEstimated Value: $82,425 - $127,000
3
Beds
2
Baths
1,066
Sq Ft
$90/Sq Ft
Est. Value
About This Home
This home is located at 133 Carver St, Sumter, SC 29150 and is currently estimated at $96,106, approximately $90 per square foot. 133 Carver St is a home located in Sumter County with nearby schools including Alice Drive Elementary School, Alice Drive Middle School, and Sumter High School.
Ownership History
Date
Name
Owned For
Owner Type
Purchase Details
Closed on
Oct 7, 2021
Sold by
Sandy Pines Properties Llc
Bought by
Sj Properties Of Sumter County Llc
Current Estimated Value
Home Financials for this Owner
Home Financials are based on the most recent Mortgage that was taken out on this home.
Original Mortgage
$280,000
Outstanding Balance
$64,032
Interest Rate
2.8%
Mortgage Type
Purchase Money Mortgage
Estimated Equity
$32,074
Purchase Details
Closed on
Apr 23, 2020
Sold by
Orc Llc
Bought by
Sandy Pines Properties Llc
Purchase Details
Closed on
Oct 23, 2006
Sold by
Green Hattie
Bought by
Orc Llc
Home Financials for this Owner
Home Financials are based on the most recent Mortgage that was taken out on this home.
Original Mortgage
$22,100
Interest Rate
6.31%
Mortgage Type
Future Advance Clause Open End Mortgage
Purchase Details
Closed on
Jul 23, 2004
Sold by
Green Vermell
Bought by
Green Hattie
Create a Home Valuation Report for This Property
The Home Valuation Report is an in-depth analysis detailing your home's value as well as a comparison with similar homes in the area
Home Values in the Area
Average Home Value in this Area
Purchase History
| Date | Buyer | Sale Price | Title Company |
|---|---|---|---|
| Sj Properties Of Sumter County Llc | $300,000 | None Available | |
| Sj Properties Of Sumter County Llc | $300,000 | None Listed On Document | |
| Sandy Pines Properties Llc | -- | None Available | |
| Orc Llc | $22,100 | -- | |
| Green Hattie | $67,500 | -- |
Source: Public Records
Mortgage History
| Date | Status | Borrower | Loan Amount |
|---|---|---|---|
| Open | Sj Properties Of Sumter County Llc | $280,000 | |
| Closed | Sj Properties Of Sumter County Llc | $280,000 | |
| Previous Owner | Orc Llc | $22,100 |
Source: Public Records
Tax History Compared to Growth
Tax History
| Year | Tax Paid | Tax Assessment Tax Assessment Total Assessment is a certain percentage of the fair market value that is determined by local assessors to be the total taxable value of land and additions on the property. | Land | Improvement |
|---|---|---|---|---|
| 2024 | $895 | $2,240 | $220 | $2,020 |
| 2023 | $895 | $2,240 | $220 | $2,020 |
| 2022 | $1,613 | $4,210 | $220 | $3,990 |
| 2021 | $1,610 | $4,210 | $220 | $3,990 |
| 2020 | $1,487 | $3,790 | $220 | $3,570 |
| 2019 | $1,480 | $3,790 | $220 | $3,570 |
| 2018 | $1,486 | $3,790 | $220 | $3,570 |
| 2017 | $1,495 | $3,790 | $220 | $3,570 |
| 2016 | $1,476 | $3,790 | $220 | $3,570 |
| 2015 | $1,513 | $3,960 | $360 | $3,600 |
| 2014 | $1,513 | $3,960 | $360 | $3,600 |
| 2013 | -- | $3,960 | $360 | $3,600 |
Source: Public Records
Map
Nearby Homes
- 332 Love St
- 29 S Purdy St
- 905 W Bartlette St
- 23 S Walker Ave
- 312 Council St
- 9 S Walker Ave
- 5 Daphne St
- 407 W Bartlette St
- 319 W Oakland Ave
- 35 Wright St
- 6 Richardson St
- 19 Capri Dr
- 17 Sam Smith St
- 25 Camellia St
- 506 Atlantic St
- 404 W Hampton Ave
- 757 Maney St
- 401 W Hampton Ave
- 11 Bobs Dr
- 1 Curtiswood Ave
- 131 Carver St
- 129 Carver St
- 134 Carver St
- 127 Carver St
- 138 Carver St
- 132 Carver St
- 140 Carver St
- 125 Carver St
- 137 Green Swamp Rd
- 123 Carver St
- 135 Green Swamp Rd
- 146 Carver St
- 120 Carver St
- 121 Carver St
- 323 Green Swamp Rd
- 131 Green Swamp Rd
- 118 Carver St
- 205 Carver St
- 206 Carver St
- 327 Green Swamp Rd