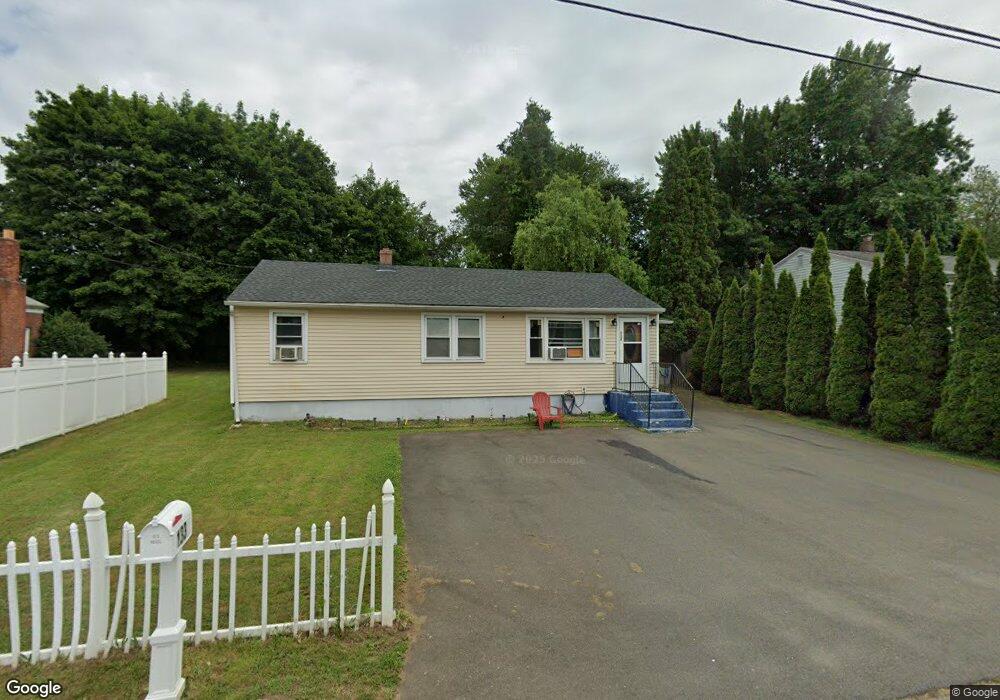
133 Crest Ave East Haven, CT 06513
Estimated Value: $311,000 - $385,000
3
Beds
2
Baths
960
Sq Ft
$359/Sq Ft
Est. Value
About This Home
This home is located at 133 Crest Ave, East Haven, CT 06513 and is currently estimated at $344,405, approximately $358 per square foot. 133 Crest Ave is a home located in New Haven County with nearby schools including Deer Run School, East Haven High School, and All Nations Christian Academy.
Ownership History
Date
Name
Owned For
Owner Type
Purchase Details
Closed on
Mar 2, 2011
Sold by
Fnma
Bought by
Neak Nina K
Current Estimated Value
Home Financials for this Owner
Home Financials are based on the most recent Mortgage that was taken out on this home.
Original Mortgage
$127,750
Outstanding Balance
$87,653
Interest Rate
4.76%
Mortgage Type
Purchase Money Mortgage
Estimated Equity
$256,752
Purchase Details
Closed on
Oct 1, 2010
Sold by
Onewest Bk Fsb
Bought by
Federal National Mortgage Association
Purchase Details
Closed on
Sep 13, 2010
Sold by
Nuzzo Michele D
Bought by
One West Bk
Purchase Details
Closed on
Nov 16, 2005
Sold by
Gonzalez Javier
Bought by
Denuzzo Michelle
Home Financials for this Owner
Home Financials are based on the most recent Mortgage that was taken out on this home.
Original Mortgage
$166,800
Interest Rate
6.07%
Purchase Details
Closed on
Feb 4, 2002
Sold by
Longo Tony
Bought by
Gonzalez Javier and Apuzzo Michelle
Purchase Details
Closed on
Apr 14, 1989
Sold by
Sabol Dorothy L
Bought by
Longo Tony
Create a Home Valuation Report for This Property
The Home Valuation Report is an in-depth analysis detailing your home's value as well as a comparison with similar homes in the area
Home Values in the Area
Average Home Value in this Area
Purchase History
| Date | Buyer | Sale Price | Title Company |
|---|---|---|---|
| Neak Nina K | $71,000 | -- | |
| Federal National Mortgage Association | -- | -- | |
| One West Bk | -- | -- | |
| Denuzzo Michelle | $208,500 | -- | |
| Gonzalez Javier | $130,000 | -- | |
| Longo Tony | $130,000 | -- |
Source: Public Records
Mortgage History
| Date | Status | Borrower | Loan Amount |
|---|---|---|---|
| Open | Longo Tony | $127,750 | |
| Previous Owner | Longo Tony | $56,000 | |
| Previous Owner | Longo Tony | $166,800 |
Source: Public Records
Tax History Compared to Growth
Tax History
| Year | Tax Paid | Tax Assessment Tax Assessment Total Assessment is a certain percentage of the fair market value that is determined by local assessors to be the total taxable value of land and additions on the property. | Land | Improvement |
|---|---|---|---|---|
| 2025 | $4,588 | $137,200 | $41,580 | $95,620 |
| 2024 | $4,588 | $137,200 | $41,580 | $95,620 |
| 2023 | $4,281 | $137,200 | $41,580 | $95,620 |
| 2022 | $4,281 | $137,200 | $41,580 | $95,620 |
| 2021 | $3,604 | $105,230 | $34,650 | $70,580 |
| 2020 | $3,604 | $105,230 | $34,650 | $70,580 |
| 2019 | $3,412 | $105,230 | $34,650 | $70,580 |
| 2018 | $3,415 | $105,230 | $34,650 | $70,580 |
| 2017 | $3,320 | $105,230 | $34,650 | $70,580 |
| 2016 | $3,299 | $104,580 | $38,110 | $66,470 |
| 2015 | $3,299 | $104,580 | $38,110 | $66,470 |
| 2014 | $3,352 | $104,580 | $38,110 | $66,470 |
Source: Public Records
Map
Nearby Homes
- 90 Foxon Blvd
- 300 Foxon Hill Rd
- 30 Thompson St
- 24 Laura Cir
- 8 Birch Ln Unit A
- 15 Cedar Ct Unit G
- 75 Redwood Dr Unit 609
- 9 Birch Ln Unit K
- 1445 Quinnipiac Ave
- 29 Melrose Dr
- 81 Melrose Dr
- 173 Russo Ave Unit 409
- 173 Russo Ave Unit 609
- 173 Russo Ave Unit 410
- 15 Glen Haven Rd
- 1423 Quinnipiac Ave Unit 808
- 1423 Quinnipiac Ave Unit 709
- 1423 Quinnipiac Ave Unit 108
- 1423 Quinnipiac Ave Unit 602
- 52 Glen Haven Rd