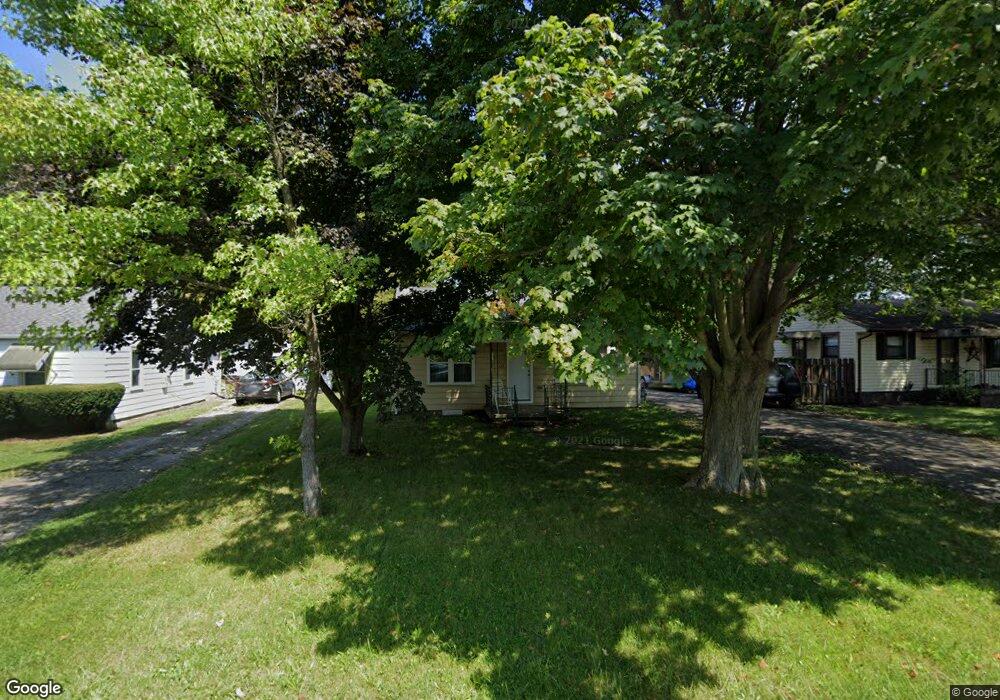
133 Dickey Ave Fairborn, OH 45324
Estimated Value: $107,000 - $184,000
2
Beds
1
Bath
1,080
Sq Ft
$139/Sq Ft
Est. Value
About This Home
This home is located at 133 Dickey Ave, Fairborn, OH 45324 and is currently estimated at $149,796, approximately $138 per square foot. 133 Dickey Ave is a home located in Greene County with nearby schools including Fairborn Primary School, Fairborn Intermediate School, and Fairborn Middle School.
Ownership History
Date
Name
Owned For
Owner Type
Purchase Details
Closed on
Apr 4, 2019
Sold by
Secretary Of Housing & Urban Development
Bought by
Kromphardt Thomas L
Current Estimated Value
Purchase Details
Closed on
Feb 7, 2019
Sold by
Deutsche Bank National Trust Co
Bought by
Secretary Of Housing & Urban Development
Purchase Details
Closed on
Jan 10, 2019
Sold by
Pesek Dakota and Pesek Dakota A
Bought by
Deutsche Bank National Trust Co and Saco 1 Inc
Purchase Details
Closed on
Oct 23, 2018
Sold by
Estate Of Kevin A Pesek
Bought by
Pesek Dakota A
Purchase Details
Closed on
Oct 13, 1999
Sold by
Pesek Tina Marie
Bought by
Pesek Kevin A
Purchase Details
Closed on
Aug 2, 1995
Sold by
Conner Joyce A
Bought by
Pesek Kevin A
Home Financials for this Owner
Home Financials are based on the most recent Mortgage that was taken out on this home.
Original Mortgage
$68,916
Interest Rate
7.56%
Mortgage Type
FHA
Create a Home Valuation Report for This Property
The Home Valuation Report is an in-depth analysis detailing your home's value as well as a comparison with similar homes in the area
Home Values in the Area
Average Home Value in this Area
Purchase History
| Date | Buyer | Sale Price | Title Company |
|---|---|---|---|
| Kromphardt Thomas L | $27,175 | Chicago Title Company Llc | |
| Secretary Of Housing & Urban Development | -- | None Available | |
| Deutsche Bank National Trust Co | $34,000 | None Available | |
| Pesek Dakota A | -- | None Available | |
| Pesek Kevin A | -- | -- | |
| Pesek Kevin A | $69,000 | -- |
Source: Public Records
Mortgage History
| Date | Status | Borrower | Loan Amount |
|---|---|---|---|
| Previous Owner | Pesek Kevin A | $68,916 |
Source: Public Records
Tax History Compared to Growth
Tax History
| Year | Tax Paid | Tax Assessment Tax Assessment Total Assessment is a certain percentage of the fair market value that is determined by local assessors to be the total taxable value of land and additions on the property. | Land | Improvement |
|---|---|---|---|---|
| 2024 | $1,380 | $27,440 | $8,200 | $19,240 |
| 2023 | $1,314 | $27,440 | $8,200 | $19,240 |
| 2022 | $1,207 | $21,210 | $5,130 | $16,080 |
| 2021 | $1,224 | $13,710 | $5,130 | $8,580 |
| 2020 | $438 | $13,710 | $5,130 | $8,580 |
| 2019 | $1,182 | $20,390 | $5,080 | $15,310 |
| 2018 | $1,446 | $20,390 | $5,080 | $15,310 |
| 2017 | $1,192 | $20,390 | $5,080 | $15,310 |
| 2016 | $1,192 | $20,340 | $5,080 | $15,260 |
| 2015 | $1,374 | $20,340 | $5,080 | $15,260 |
| 2014 | $1,100 | $20,340 | $5,080 | $15,260 |
Source: Public Records
Map
Nearby Homes
- 2908 Valleyview Dr
- 350 Bishea Ct
- 2295 Murphy Dr
- 137 W Dayton Yellow Springs Rd
- 109 S Point Dr
- 109 S South Point Dr
- 552 W Funderburg Rd
- 454 Thompson Dr
- 0000 Boxwood Dr
- 543 W Funderburg Rd
- 1823 Wilbur Ave Unit 1825
- 488 Thompson Dr
- 123 S Point Dr
- 301 Faculty Dr
- 1807 Montgomery Ave
- Lot 4 W Dayton-Yellow Springs Rd
- Lot 3 W Dayton-Yellow Springs Rd
- 1830 Rice Blvd
- 1558 Glendale Dr
- 1463 Maplegrove Dr