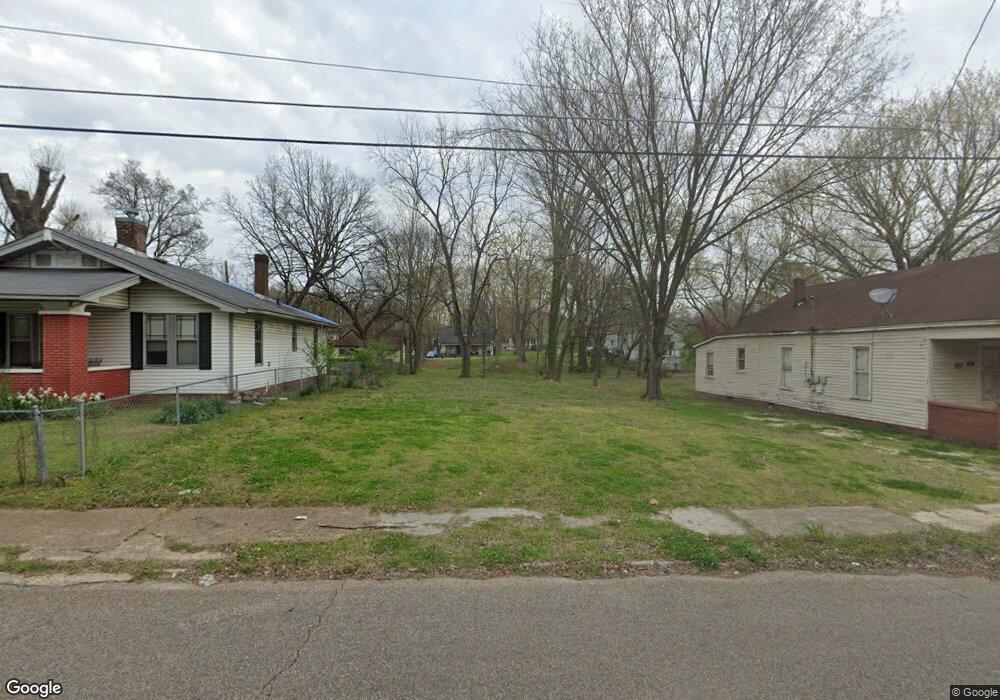
133 Dupree St Jackson, TN 38301
Downtown Jackson NeighborhoodEstimated Value: $63,833
Studio
1
Bath
1,376
Sq Ft
$46/Sq Ft
Est. Value
About This Home
This home is located at 133 Dupree St, Jackson, TN 38301 and is currently estimated at $63,833, approximately $46 per square foot. 133 Dupree St is a home located in Madison County with nearby schools including Isaac Lane Technology Magnet Elementary School and Liberty Technology Magnet High School.
Ownership History
Date
Name
Owned For
Owner Type
Purchase Details
Closed on
Nov 6, 2019
Sold by
Williams Lucy
Bought by
Jackson Community Redevelopment Agency
Current Estimated Value
Home Financials for this Owner
Home Financials are based on the most recent Mortgage that was taken out on this home.
Original Mortgage
$25,000
Outstanding Balance
$21,873
Interest Rate
3.65%
Mortgage Type
Stand Alone Second
Estimated Equity
$41,960
Purchase Details
Closed on
Dec 18, 1991
Bought by
Williams Leroy
Purchase Details
Closed on
Feb 1, 1991
Bought by
Johnson Nathan L
Purchase Details
Closed on
Mar 28, 1942
Bought by
Lena Jones L and Lena Lillian
Create a Home Valuation Report for This Property
The Home Valuation Report is an in-depth analysis detailing your home's value as well as a comparison with similar homes in the area
Home Values in the Area
Average Home Value in this Area
Purchase History
We collect this data history from publicly available records. To have your information removed, we recommend requesting removal directly through your county’s website.
| Date | Buyer | Sale Price | Title Company |
|---|---|---|---|
| Jackson Community Redevelopment Agency | $38,500 | None Available | |
| Williams Leroy | $22,000 | -- | |
| Johnson Nathan L | $7,500 | -- | |
| Lena Jones L | -- | -- |
Source: Public Records
Mortgage History
We collect this data history from publicly available records. To have your information removed, we recommend requesting removal directly through your county’s website.
| Date | Status | Borrower | Loan Amount |
|---|---|---|---|
| Open | Jackson Community Redevelopment Agency | $25,000 |
Source: Public Records
Tax History
| Year | Tax Paid | Tax Assessment Tax Assessment Total Assessment is a certain percentage of the fair market value that is determined by local assessors to be the total taxable value of land and additions on the property. | Land | Improvement |
|---|---|---|---|---|
| 2025 | -- | -- | -- | -- |
| 2024 | -- | -- | -- | -- |
| 2022 | $0 | $0 | $0 | $0 |
| 2021 | $415 | $0 | $0 | $0 |
| 2020 | $0 | $0 | $0 | $0 |
| 2019 | $415 | $0 | $0 | $0 |
| 2018 | $415 | $9,625 | $1,000 | $8,625 |
| 2017 | $395 | $8,950 | $1,000 | $7,950 |
| 2016 | $423 | $10,300 | $1,000 | $9,300 |
| 2015 | $424 | $10,300 | $1,000 | $9,300 |
| 2014 | $424 | $10,300 | $1,000 | $9,300 |
Source: Public Records
Map
Nearby Homes
- 169 Dupree St
- 521 N Hays Ave
- 160 Tomlin St
- 130 Elizabeth St
- 132 Elizabeth St
- 431 Preston St
- 510 Preston St
- 676 N Hays Ave
- 329 N Lindsey St
- 327 N Lindsey St
- 513 Preston St
- 420 Lexington Ave
- 435 Lexington Ave
- 237 Oak St
- 243 Oak St
- 113 Gates St
- 116 Stoddert St
- 122 Preston Aly
- 241 S Lindsey St
- 850 Lane Ave
Your Personal Tour Guide
Ask me questions while you tour the home.