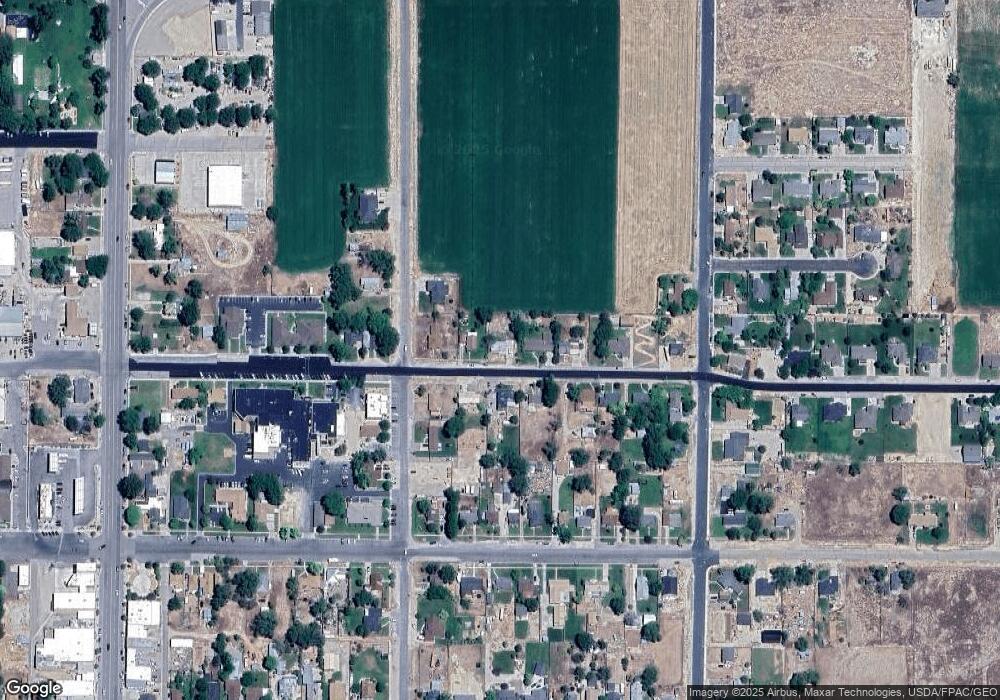
133 E 100 St N Gunnison, UT 84634
Gunnison NeighborhoodEstimated Value: $234,000 - $275,028
3
Beds
2
Baths
1,162
Sq Ft
$224/Sq Ft
Est. Value
About This Home
This home is located at 133 E 100 St N, Gunnison, UT 84634 and is currently estimated at $260,507, approximately $224 per square foot. 133 E 100 St N is a home located in Sanpete County.
Ownership History
Date
Name
Owned For
Owner Type
Purchase Details
Closed on
Sep 11, 2024
Sold by
Arthur Brian
Bought by
Owens Vicki A
Current Estimated Value
Home Financials for this Owner
Home Financials are based on the most recent Mortgage that was taken out on this home.
Original Mortgage
$75,000
Outstanding Balance
$72,715
Interest Rate
0.61%
Mortgage Type
Construction
Estimated Equity
$187,792
Purchase Details
Closed on
Jan 23, 2020
Sold by
Maughan James R
Bought by
Walsh Barry D
Home Financials for this Owner
Home Financials are based on the most recent Mortgage that was taken out on this home.
Original Mortgage
$83,600
Interest Rate
3.73%
Mortgage Type
Construction
Create a Home Valuation Report for This Property
The Home Valuation Report is an in-depth analysis detailing your home's value as well as a comparison with similar homes in the area
Home Values in the Area
Average Home Value in this Area
Purchase History
| Date | Buyer | Sale Price | Title Company |
|---|---|---|---|
| Owens Vicki A | $93,750 | Chicago Title Draper | |
| Walsh Barry D | $104,500 | Cornerstone Title Ins Agcy |
Source: Public Records
Mortgage History
| Date | Status | Borrower | Loan Amount |
|---|---|---|---|
| Open | Owens Vicki A | $75,000 | |
| Previous Owner | Walsh Barry D | $83,600 |
Source: Public Records
Tax History Compared to Growth
Tax History
| Year | Tax Paid | Tax Assessment Tax Assessment Total Assessment is a certain percentage of the fair market value that is determined by local assessors to be the total taxable value of land and additions on the property. | Land | Improvement |
|---|---|---|---|---|
| 2024 | $938 | $84,969 | $0 | $0 |
| 2023 | $890 | $75,278 | $0 | $0 |
| 2022 | $861 | $67,212 | $0 | $0 |
| 2021 | $820 | $55,421 | $0 | $0 |
| 2020 | $770 | $48,764 | $0 | $0 |
| 2019 | $736 | $45,454 | $0 | $0 |
| 2018 | $722 | $77,033 | $19,800 | $57,233 |
| 2017 | $685 | $42,368 | $0 | $0 |
| 2016 | $644 | $39,879 | $0 | $0 |
| 2015 | $645 | $39,879 | $0 | $0 |
| 2014 | $635 | $39,879 | $0 | $0 |
| 2013 | $631 | $39,758 | $0 | $0 |
Source: Public Records
Map
Nearby Homes