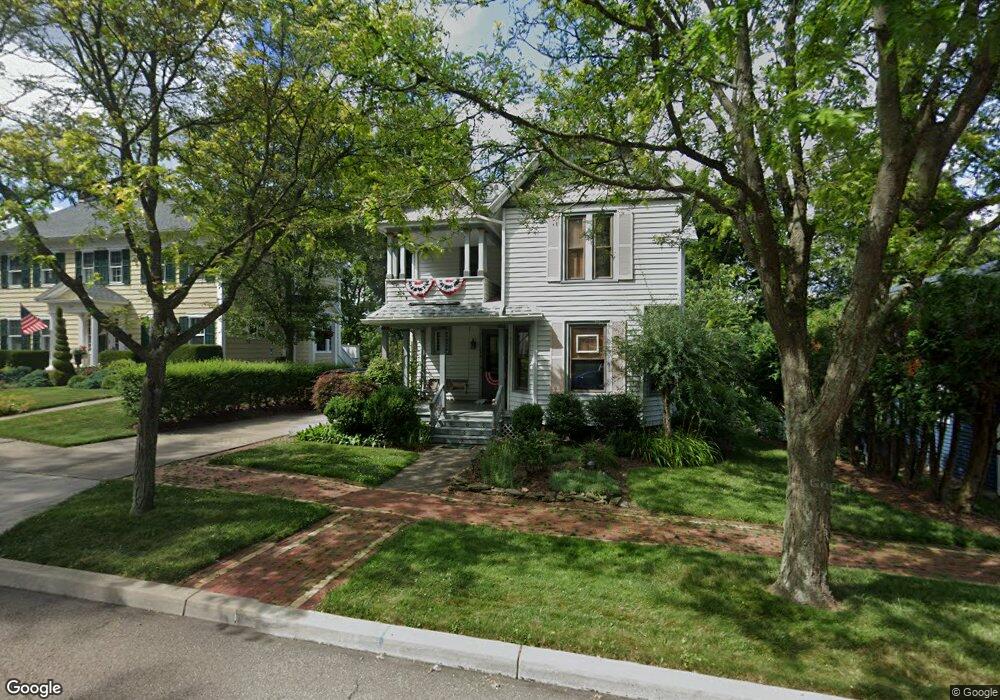
133 E 4th St Corning, NY 14830
Estimated Value: $261,000 - $285,881
4
Beds
2
Baths
2,080
Sq Ft
$133/Sq Ft
Est. Value
About This Home
This home is located at 133 E 4th St, Corning, NY 14830 and is currently estimated at $275,720, approximately $132 per square foot. 133 E 4th St is a home located in Steuben County with nearby schools including Frederick Carder Elementary School, Corning-Painted Post Middle School, and Corning-Painted Post High School.
Ownership History
Date
Name
Owned For
Owner Type
Purchase Details
Closed on
Aug 27, 2010
Sold by
Underwood Sarah
Bought by
Ishikawa Tomohiro
Current Estimated Value
Home Financials for this Owner
Home Financials are based on the most recent Mortgage that was taken out on this home.
Original Mortgage
$165,000
Outstanding Balance
$103,217
Interest Rate
4.55%
Mortgage Type
Purchase Money Mortgage
Estimated Equity
$172,503
Purchase Details
Closed on
Sep 29, 1995
Sold by
Donald George E Donald Kimberl
Bought by
Heermans John R
Create a Home Valuation Report for This Property
The Home Valuation Report is an in-depth analysis detailing your home's value as well as a comparison with similar homes in the area
Home Values in the Area
Average Home Value in this Area
Purchase History
| Date | Buyer | Sale Price | Title Company |
|---|---|---|---|
| Ishikawa Tomohiro | $195,000 | -- | |
| Heermans John R | $168,000 | -- |
Source: Public Records
Mortgage History
| Date | Status | Borrower | Loan Amount |
|---|---|---|---|
| Open | Ishikawa Tomohiro | $165,000 |
Source: Public Records
Tax History
| Year | Tax Paid | Tax Assessment Tax Assessment Total Assessment is a certain percentage of the fair market value that is determined by local assessors to be the total taxable value of land and additions on the property. | Land | Improvement |
|---|---|---|---|---|
| 2024 | $7,387 | $269,000 | $23,100 | $245,900 |
| 2023 | $7,469 | $269,000 | $23,100 | $245,900 |
| 2022 | $9,642 | $205,000 | $20,900 | $184,100 |
| 2021 | $7,092 | $205,000 | $20,900 | $184,100 |
| 2020 | $4,082 | $205,000 | $20,900 | $184,100 |
| 2019 | $8,417 | $205,000 | $20,900 | $184,100 |
| 2018 | $8,417 | $205,000 | $20,900 | $184,100 |
| 2017 | $6,048 | $205,000 | $20,900 | $184,100 |
| 2016 | $5,985 | $205,000 | $20,900 | $184,100 |
| 2015 | -- | $205,000 | $20,900 | $184,100 |
| 2014 | -- | $205,000 | $20,900 | $184,100 |
Source: Public Records
Map
Nearby Homes
Your Personal Tour Guide
Ask me questions while you tour the home.