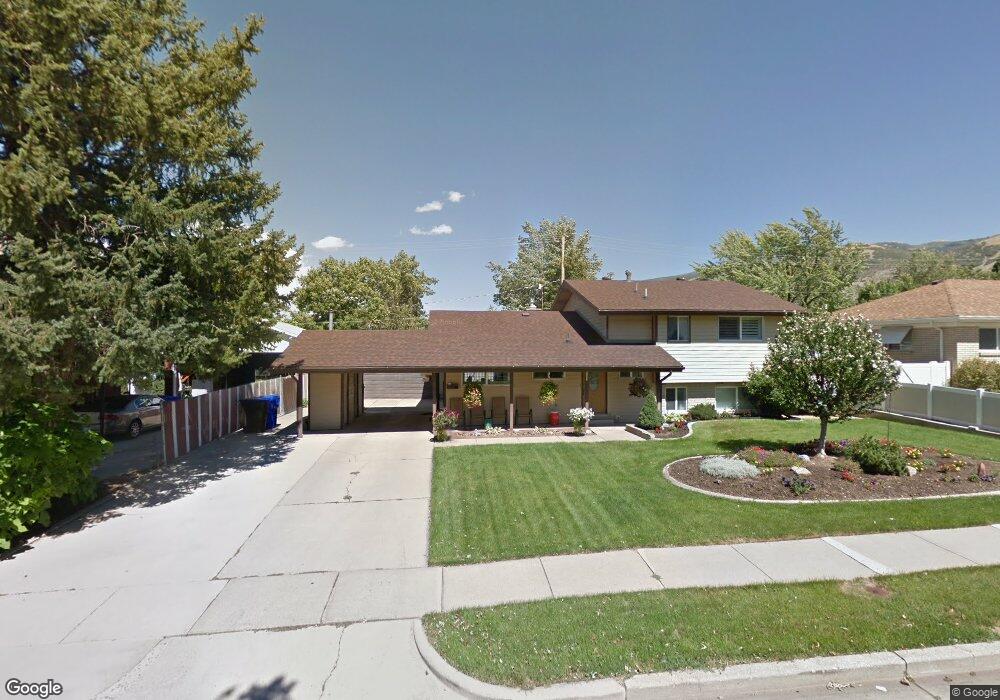
133 E 800 N Bountiful, UT 84010
Estimated Value: $525,000 - $612,000
4
Beds
3
Baths
1,914
Sq Ft
$288/Sq Ft
Est. Value
About This Home
This home is located at 133 E 800 N, Bountiful, UT 84010 and is currently estimated at $551,055, approximately $287 per square foot. 133 E 800 N is a home located in Davis County with nearby schools including Tolman School, Bountiful Junior High School, and Viewmont High School.
Ownership History
Date
Name
Owned For
Owner Type
Purchase Details
Closed on
Sep 10, 2024
Sold by
Robert And Suzanne Kent Family Revocable and Kent Robert Stanley
Bought by
Chavez-May Marie Carmen
Current Estimated Value
Home Financials for this Owner
Home Financials are based on the most recent Mortgage that was taken out on this home.
Original Mortgage
$506,160
Outstanding Balance
$499,979
Interest Rate
6.47%
Mortgage Type
New Conventional
Estimated Equity
$51,076
Purchase Details
Closed on
Dec 19, 2023
Sold by
Kent Robert S
Bought by
Robert And Suzanne Kent Family Revocable Trus and Kent
Create a Home Valuation Report for This Property
The Home Valuation Report is an in-depth analysis detailing your home's value as well as a comparison with similar homes in the area
Purchase History
| Date | Buyer | Sale Price | Title Company |
|---|---|---|---|
| Chavez-May Marie Carmen | -- | Meridian Title | |
| Robert And Suzanne Kent Family Revocable Trus | -- | None Listed On Document |
Source: Public Records
Mortgage History
| Date | Status | Borrower | Loan Amount |
|---|---|---|---|
| Open | Chavez-May Marie Carmen | $506,160 |
Source: Public Records
Tax History
| Year | Tax Paid | Tax Assessment Tax Assessment Total Assessment is a certain percentage of the fair market value that is determined by local assessors to be the total taxable value of land and additions on the property. | Land | Improvement |
|---|---|---|---|---|
| 2025 | $2,966 | $272,800 | $119,363 | $153,437 |
| 2024 | $2,724 | $259,601 | $103,065 | $156,536 |
| 2023 | $2,583 | $446,000 | $192,972 | $253,028 |
| 2022 | $2,730 | $259,051 | $106,288 | $152,763 |
| 2021 | $2,352 | $340,000 | $138,956 | $201,044 |
| 2020 | $1,940 | $280,000 | $121,260 | $158,740 |
| 2019 | $1,963 | $277,000 | $135,195 | $141,805 |
| 2018 | $1,817 | $252,000 | $132,691 | $119,309 |
| 2016 | $1,576 | $118,360 | $52,919 | $65,441 |
| 2015 | $1,593 | $113,245 | $52,919 | $60,326 |
| 2014 | $1,401 | $101,604 | $52,919 | $48,685 |
| 2013 | -- | $93,365 | $40,825 | $52,540 |
Source: Public Records
Map
Nearby Homes
- 453 N 400 E Unit 7-D
- 106 W 700 N
- 1420 N Main St
- 184 Park Shadows Cir
- 345 N 400 E
- 49 E 200 N Unit 4
- 41 E 200 N Unit 6
- 252 N Main St
- 256 N Main St
- 254 N Main St
- 1130 N 200 W
- 55 E 200 N Unit 2
- 51 E 200 N Unit 3
- 1260 N 200 W
- 563 N 200 W
- 499 N 200 W Unit 30
- 320 N 200 W Unit 4
- 332 N 300 W
- 235 W 1400 N
- 662 E 1200 N
Your Personal Tour Guide
Ask me questions while you tour the home.