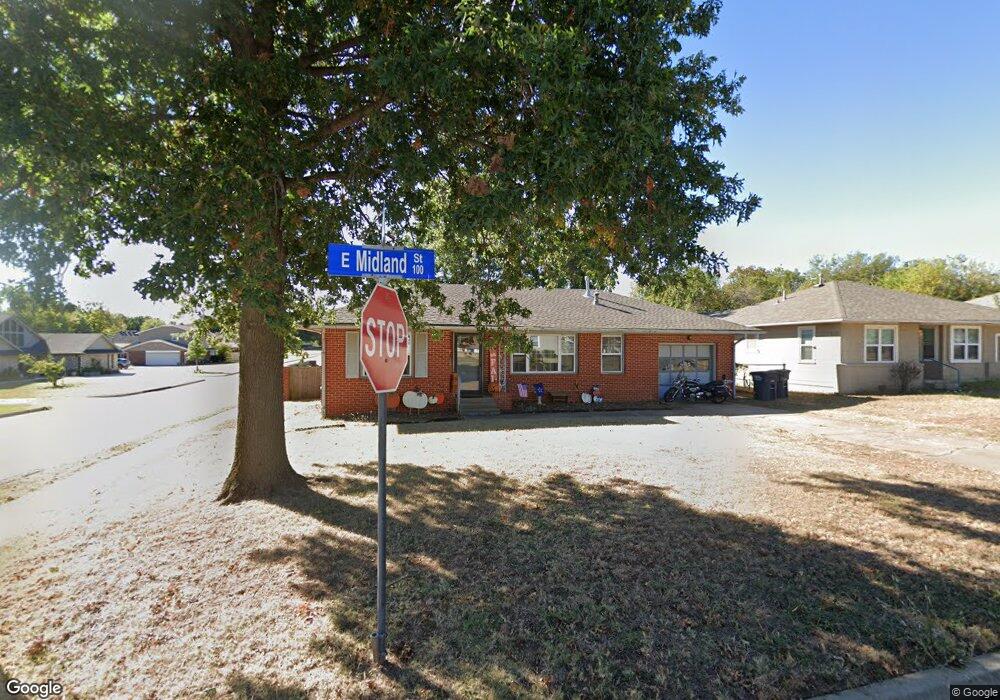
133 E Midland St Shawnee, OK 74804
Estimated Value: $116,188 - $165,000
3
Beds
2
Baths
1,397
Sq Ft
$98/Sq Ft
Est. Value
About This Home
This home is located at 133 E Midland St, Shawnee, OK 74804 and is currently estimated at $136,547, approximately $97 per square foot. 133 E Midland St is a home located in Pottawatomie County with nearby schools including Will Rogers Elementary School, Shawnee Middle School, and Shawnee High School.
Ownership History
Date
Name
Owned For
Owner Type
Purchase Details
Closed on
Mar 20, 2018
Sold by
Stripe Bengamin D and Stripe Nona M
Bought by
Richard Clancy L and Richard Elizabeth G
Current Estimated Value
Purchase Details
Closed on
Nov 25, 2013
Sold by
Kienzle Florence L
Bought by
Stripe Benjamin D and Stripe Nona May
Home Financials for this Owner
Home Financials are based on the most recent Mortgage that was taken out on this home.
Original Mortgage
$50,000
Interest Rate
4.29%
Mortgage Type
New Conventional
Purchase Details
Closed on
Jun 12, 1998
Sold by
Christiansen John and Christiansen B
Bought by
Kienzle Florence
Purchase Details
Closed on
Sep 18, 1996
Sold by
Hopkins David and Hopkins Shelli
Bought by
Christiansen John and Christiansen B
Purchase Details
Closed on
Jun 9, 1994
Sold by
Mclaughlin Susan and Mclaughlin Clay W
Bought by
Hopkins David and Hopkins Shelli
Create a Home Valuation Report for This Property
The Home Valuation Report is an in-depth analysis detailing your home's value as well as a comparison with similar homes in the area
Purchase History
| Date | Buyer | Sale Price | Title Company |
|---|---|---|---|
| Richard Clancy L | $40,000 | None Available | |
| Stripe Benjamin D | $80,000 | Choice Title Insurance | |
| Stripe Benjamin D | $80,000 | Choice Title Insurance | |
| Kienzle Florence | $73,000 | -- | |
| Christiansen John | $71,000 | -- | |
| Hopkins David | $60,500 | -- |
Source: Public Records
Mortgage History
| Date | Status | Borrower | Loan Amount |
|---|---|---|---|
| Previous Owner | Stripe Benjamin D | $50,000 |
Source: Public Records
Tax History
| Year | Tax Paid | Tax Assessment Tax Assessment Total Assessment is a certain percentage of the fair market value that is determined by local assessors to be the total taxable value of land and additions on the property. | Land | Improvement |
|---|---|---|---|---|
| 2025 | $648 | $6,600 | $1,080 | $5,520 |
| 2023 | $625 | $5,986 | $1,080 | $4,906 |
| 2022 | $614 | $5,986 | $1,080 | $4,906 |
| 2021 | $603 | $5,986 | $1,080 | $4,906 |
| 2020 | $605 | $5,988 | $1,080 | $4,908 |
| 2019 | $625 | $5,989 | $1,080 | $4,909 |
| 2018 | $1,194 | $11,668 | $1,038 | $10,630 |
| 2017 | $1,121 | $11,112 | $972 | $10,140 |
| 2016 | $1,080 | $10,583 | $918 | $9,665 |
| 2015 | $1,008 | $10,080 | $804 | $9,276 |
| 2014 | $960 | $9,600 | $1,200 | $8,400 |
Source: Public Records
Map
Nearby Homes
- 404 E Franklin St
- 1921 N Bell Ave
- 115 W Georgia St
- 2415 N Minnesota Cir
- 1919 N Union Ave
- 1901 N Bell Ave
- 1928 N Broadway Ave
- 2304 N Tucker Ave
- 216 W Georgia St
- 1926 N Market Ave
- 2615 N Market Ave
- 806 E Midland St
- 1822 N Philadelphia Ave
- 210 E Cammack
- 3306 N Oklahoma Ave
- 3003 N Bell Ave
- 1712 N Pennsylvania Ave
- 1725 N Louisa Ave
- 1607 N Beard Ave
- 3406 N Market Ave
- 101 E Midland St
- 121 E Midland St
- 2301 N Bell Ave
- 127 E Midland St
- 120 E Midland St
- 2207 N Union Ave
- 106 E Franklin St
- 114 E Franklin St
- 102 E Franklin St
- 122 E Midland St
- 116 E Franklin St
- 27 E Midland St
- 134 E Midland St
- 26 E Midland St
- 25 E Midland St
- 16 E Franklin St
- 105 E Georgia St
- 2202 N Union Ave
- 2321 N Bell Ave
Your Personal Tour Guide
Ask me questions while you tour the home.