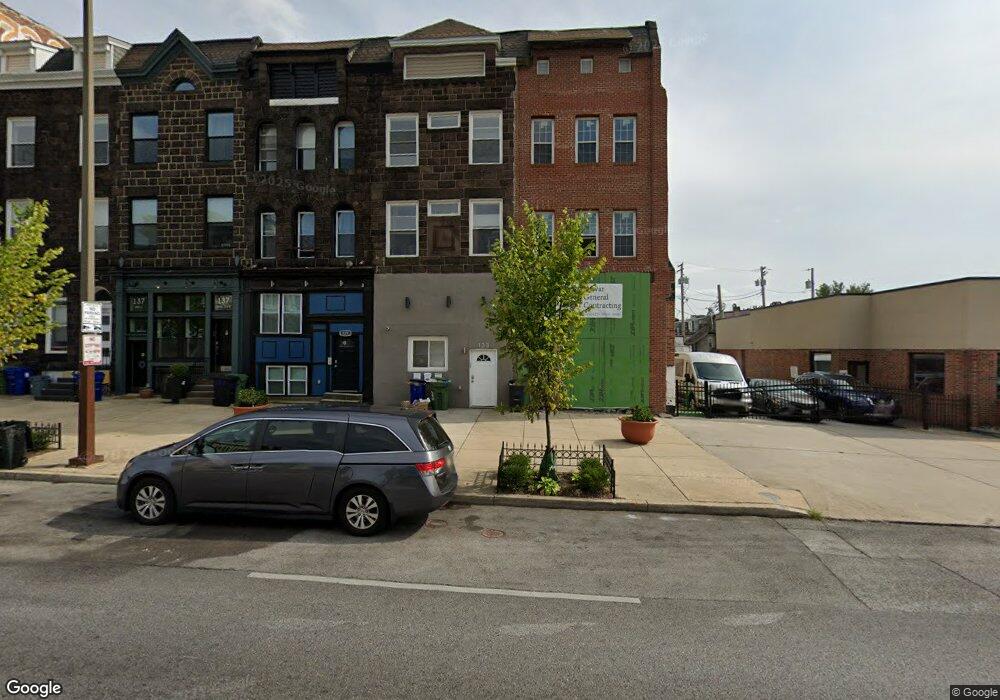
133 E North Ave Baltimore, MD 21202
Station North NeighborhoodEstimated Value: $482,278
2
Beds
1
Bath
1,350
Sq Ft
$357/Sq Ft
Est. Value
About This Home
This home is located at 133 E North Ave, Baltimore, MD 21202 and is currently estimated at $482,278, approximately $357 per square foot. 133 E North Ave is a home located in Baltimore City with nearby schools including Booker T. Washington Middle School, Paul Laurence Dunbar High School, and Frederick Douglass High School.
Ownership History
Date
Name
Owned For
Owner Type
Purchase Details
Closed on
Mar 18, 2024
Sold by
Vayeira Llc
Bought by
Integra Realty Llc
Current Estimated Value
Home Financials for this Owner
Home Financials are based on the most recent Mortgage that was taken out on this home.
Original Mortgage
$390,000
Outstanding Balance
$383,835
Interest Rate
6.9%
Mortgage Type
New Conventional
Estimated Equity
$98,443
Purchase Details
Closed on
Mar 3, 2022
Sold by
Behar Group Llc
Bought by
Vayeira Llc
Purchase Details
Closed on
Oct 22, 2015
Sold by
One House At A Time Inc
Bought by
Behar Group Llc
Purchase Details
Closed on
May 3, 2012
Sold by
One House At Time Inc
Bought by
Class Act Realty Llc
Purchase Details
Closed on
Mar 28, 2007
Sold by
Parker John H
Bought by
Ford Stella
Home Financials for this Owner
Home Financials are based on the most recent Mortgage that was taken out on this home.
Original Mortgage
$78,000
Interest Rate
6.33%
Mortgage Type
Credit Line Revolving
Create a Home Valuation Report for This Property
The Home Valuation Report is an in-depth analysis detailing your home's value as well as a comparison with similar homes in the area
Home Values in the Area
Average Home Value in this Area
Purchase History
| Date | Buyer | Sale Price | Title Company |
|---|---|---|---|
| Integra Realty Llc | $520,000 | None Listed On Document | |
| Integra Realty Llc | $520,000 | None Listed On Document | |
| Vayeira Llc | -- | Salazar Law Pc | |
| Behar Group Llc | $28,000 | Servicelink | |
| Class Act Realty Llc | $7,000 | Cotton Duck Title Company | |
| Ford Stella | $97,000 | -- |
Source: Public Records
Mortgage History
| Date | Status | Borrower | Loan Amount |
|---|---|---|---|
| Open | Integra Realty Llc | $390,000 | |
| Closed | Integra Realty Llc | $390,000 | |
| Previous Owner | Ford Stella | $78,000 |
Source: Public Records
Tax History
| Year | Tax Paid | Tax Assessment Tax Assessment Total Assessment is a certain percentage of the fair market value that is determined by local assessors to be the total taxable value of land and additions on the property. | Land | Improvement |
|---|---|---|---|---|
| 2025 | $3,548 | $165,400 | $33,300 | $132,100 |
| 2024 | $3,548 | $150,333 | -- | -- |
| 2023 | $3,192 | $135,267 | $0 | $0 |
| 2022 | $2,837 | $120,200 | $33,300 | $86,900 |
| 2021 | $2,274 | $96,367 | $0 | $0 |
| 2020 | $1,712 | $72,533 | $0 | $0 |
| 2019 | $1,144 | $48,700 | $33,300 | $15,400 |
| 2018 | $1,149 | $48,700 | $33,300 | $15,400 |
| 2017 | $1,149 | $48,700 | $0 | $0 |
| 2016 | $2,416 | $97,500 | $0 | $0 |
| 2015 | $2,416 | $97,500 | $0 | $0 |
| 2014 | $2,416 | $97,500 | $0 | $0 |
Source: Public Records
Map
Nearby Homes
- 202 E Lafayette Ave
- 1824 Saint Paul St
- 1931 Saint Paul St
- 221 E Lafayette Ave
- 112 E 20th St
- 1704 Saint Paul St
- 1628 N Calvert St
- 321 E 21st St
- 1609 Saint Paul St
- 413 Mcallister St
- 2106 Saint Paul St
- 2019 Barclay St
- 400 Pitman Place
- 422 E Lanvale St
- 401 Pitman Place
- 501 E 20th St
- 412 E 21st St
- 407 Pitman Place
- 2225 Saint Paul St
- 456 Pitman Place
- 133 E North Ave Unit 1, 1ST-FLOOR
- 135 E North Ave
- 135 E North Ave Unit 2
- 131 E North Ave Unit 1ST FLR
- 131 E North Ave Unit 3RD FLR
- 131 E North Ave Unit 2ND FLR
- 131 E North Ave
- 137 E North Ave
- 137 E North Ave Unit 3
- 137 E North Ave Unit 2
- 137 E North Ave Unit 1
- 139 E North Ave Unit 3
- 139 E North Ave Unit 2
- 139 E North Ave
- 127 E North Ave
- 141 E North Ave
- 141 E North Ave Unit 3
- 141 E North Ave
- 143 E North Ave Unit 3
- 143 E North Ave Unit 4
Your Personal Tour Guide
Ask me questions while you tour the home.