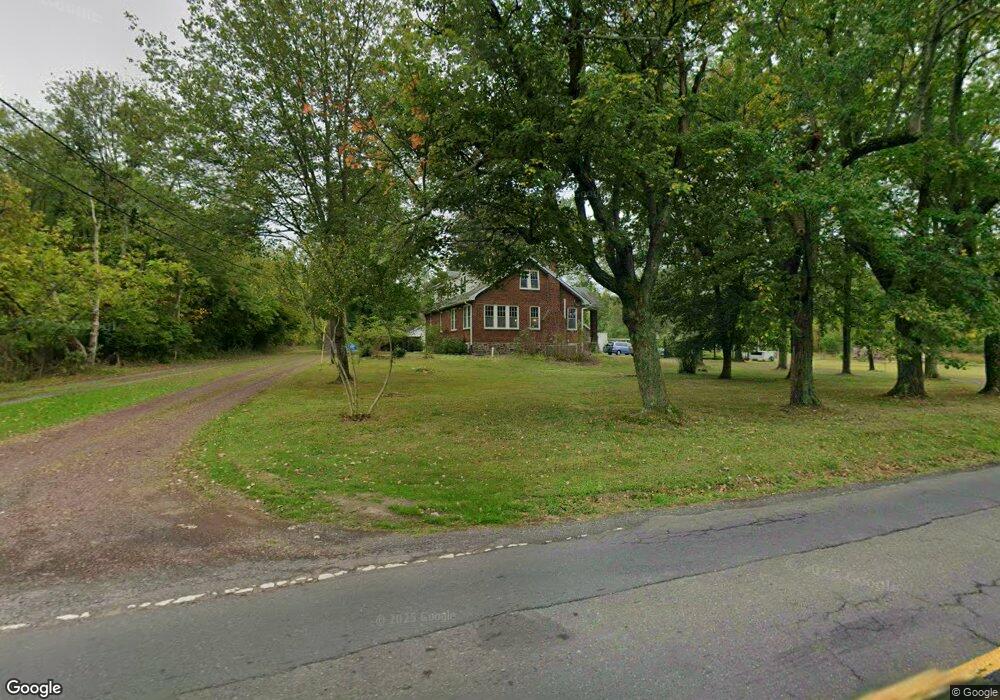
133 Edison Furlong Rd Doylestown, PA 18901
Estimated Value: $479,000 - $659,000
3
Beds
2
Baths
2,376
Sq Ft
$239/Sq Ft
Est. Value
About This Home
This home is located at 133 Edison Furlong Rd, Doylestown, PA 18901 and is currently estimated at $568,984, approximately $239 per square foot. 133 Edison Furlong Rd is a home located in Bucks County with nearby schools including Bridge Valley Elementary School, Lenape Middle School, and Central Bucks High School-West.
Ownership History
Date
Name
Owned For
Owner Type
Purchase Details
Closed on
Sep 17, 2020
Sold by
Tilley Michael B
Bought by
Starkey Jonathan D and Starkey Kaitlyn S
Current Estimated Value
Home Financials for this Owner
Home Financials are based on the most recent Mortgage that was taken out on this home.
Original Mortgage
$313,500
Outstanding Balance
$277,695
Interest Rate
2.8%
Mortgage Type
New Conventional
Estimated Equity
$291,289
Purchase Details
Closed on
Sep 23, 2005
Sold by
Schultz Donald H
Bought by
Tilley Michael B
Home Financials for this Owner
Home Financials are based on the most recent Mortgage that was taken out on this home.
Original Mortgage
$242,250
Interest Rate
5.72%
Mortgage Type
Fannie Mae Freddie Mac
Purchase Details
Closed on
Aug 13, 1962
Bought by
Grafly Frank A and Grafly Frank A
Create a Home Valuation Report for This Property
The Home Valuation Report is an in-depth analysis detailing your home's value as well as a comparison with similar homes in the area
Home Values in the Area
Average Home Value in this Area
Purchase History
| Date | Buyer | Sale Price | Title Company |
|---|---|---|---|
| Starkey Jonathan D | $330,000 | Germmantown Title Company | |
| Tilley Michael B | $255,000 | None Available | |
| Grafly Frank A | -- | -- |
Source: Public Records
Mortgage History
| Date | Status | Borrower | Loan Amount |
|---|---|---|---|
| Open | Starkey Jonathan D | $313,500 | |
| Previous Owner | Tilley Michael B | $242,250 |
Source: Public Records
Tax History Compared to Growth
Tax History
| Year | Tax Paid | Tax Assessment Tax Assessment Total Assessment is a certain percentage of the fair market value that is determined by local assessors to be the total taxable value of land and additions on the property. | Land | Improvement |
|---|---|---|---|---|
| 2025 | $4,247 | $24,000 | $7,120 | $16,880 |
| 2024 | $4,247 | $24,000 | $7,120 | $16,880 |
| 2023 | $4,050 | $24,000 | $7,120 | $16,880 |
| 2022 | $4,005 | $24,000 | $7,120 | $16,880 |
| 2021 | $3,922 | $24,000 | $7,120 | $16,880 |
| 2020 | $3,904 | $24,000 | $7,120 | $16,880 |
| 2019 | $3,862 | $24,000 | $7,120 | $16,880 |
| 2018 | $3,850 | $24,000 | $7,120 | $16,880 |
| 2017 | $3,820 | $24,000 | $7,120 | $16,880 |
| 2016 | $3,796 | $24,000 | $7,120 | $16,880 |
| 2015 | -- | $24,000 | $7,120 | $16,880 |
| 2014 | -- | $24,000 | $7,120 | $16,880 |
Source: Public Records
Map
Nearby Homes
- 125 Edison Furlong Rd
- 1 Squirrel Rd
- 60 Quarry Rd
- 45 Bedford Ave
- 17 Addison Ct Unit 2703
- 82 Avalon Ct Unit 2005
- 137 Pebble Woods Dri Pebble Woods Dr
- 420 Edison Furlong Rd
- 78 Tower Hill Rd
- 2320 Turk Rd
- 1249 Pebble Hill Rd
- 2385 Waverly Dr
- 21 Shady Springs Dr
- 272 Fox Chase Ln
- 3 Steeplechase Dr
- 222 Windsor Way
- 403 S Main St Unit S201
- 547 Mccarty Dr
- 89 Homestead Dr
- 152 Watercrest Dr
- 135 Edison Furlong Rd
- 135 Edison Rd
- 2 Willowbrook Dr
- 3331 Edison Furlong Rd
- 588 Edison Furlong Rd
- 10 Willowbrook Dr
- 112 Edison Furlong Rd
- 137 Edison Furlong Rd
- 18 Willowbrook Dr
- 158 Edison Furlong Rd
- 1835 S Easton Rd
- 26 Willowbrook Dr
- 15 Willowbrook Dr
- 105 Edison Furlong Rd
- 23 Willowbrook Dr
- 7 Squirrel Rd
- 34 Willowbrook Dr
- 101 Edison Furlong Rd
- 31 Willowbrook Dr
- 1796 S Easton Rd