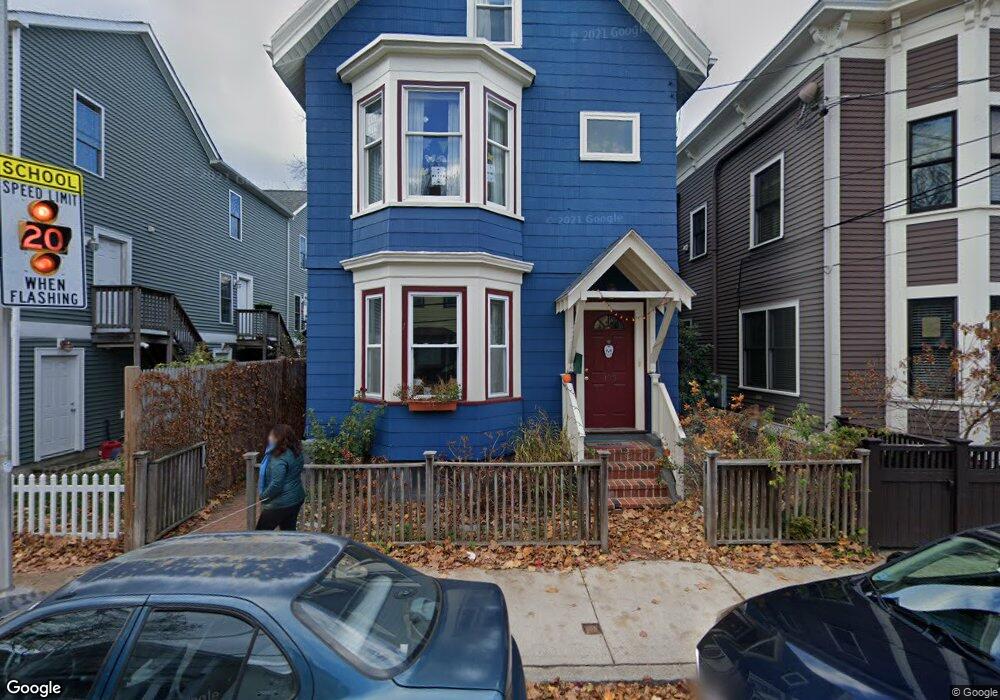
133 Elm St Unit 2 Cambridge, MA 02139
The Port NeighborhoodEstimated Value: $1,082,000 - $1,225,000
3
Beds
2
Baths
1,370
Sq Ft
$838/Sq Ft
Est. Value
About This Home
This home is located at 133 Elm St Unit 2, Cambridge, MA 02139 and is currently estimated at $1,147,598, approximately $837 per square foot. 133 Elm St Unit 2 is a home located in Middlesex County with nearby schools including Prospect Hill Academy Charter School and Community Charter School of Cambridge.
Ownership History
Date
Name
Owned For
Owner Type
Purchase Details
Closed on
Jun 30, 2009
Sold by
Mclean Gwendolyn
Bought by
Fentress Sam W
Current Estimated Value
Home Financials for this Owner
Home Financials are based on the most recent Mortgage that was taken out on this home.
Original Mortgage
$255,000
Outstanding Balance
$163,099
Interest Rate
4.92%
Mortgage Type
Purchase Money Mortgage
Estimated Equity
$984,499
Purchase Details
Closed on
Apr 27, 2001
Sold by
Walters Alejandro and Kretsinger Katrina
Bought by
Mclean Gwendolyn C
Home Financials for this Owner
Home Financials are based on the most recent Mortgage that was taken out on this home.
Original Mortgage
$275,000
Interest Rate
6.88%
Mortgage Type
Purchase Money Mortgage
Create a Home Valuation Report for This Property
The Home Valuation Report is an in-depth analysis detailing your home's value as well as a comparison with similar homes in the area
Home Values in the Area
Average Home Value in this Area
Purchase History
| Date | Buyer | Sale Price | Title Company |
|---|---|---|---|
| Fentress Sam W | $425,000 | -- | |
| Mclean Gwendolyn C | $385,000 | -- |
Source: Public Records
Mortgage History
| Date | Status | Borrower | Loan Amount |
|---|---|---|---|
| Open | Fentress Sam W | $255,000 | |
| Previous Owner | Mclean Gwendolyn C | $275,000 | |
| Closed | Mclean Gwendolyn C | $33,000 |
Source: Public Records
Tax History Compared to Growth
Tax History
| Year | Tax Paid | Tax Assessment Tax Assessment Total Assessment is a certain percentage of the fair market value that is determined by local assessors to be the total taxable value of land and additions on the property. | Land | Improvement |
|---|---|---|---|---|
| 2025 | $6,372 | $1,003,400 | $0 | $1,003,400 |
| 2024 | $5,972 | $1,008,800 | $0 | $1,008,800 |
| 2023 | $4,291 | $732,200 | $0 | $732,200 |
| 2022 | $4,274 | $721,900 | $0 | $721,900 |
| 2021 | $4,182 | $714,900 | $0 | $714,900 |
| 2020 | $3,902 | $678,600 | $0 | $678,600 |
| 2019 | $3,739 | $629,500 | $0 | $629,500 |
| 2018 | $1,489 | $571,700 | $0 | $571,700 |
| 2017 | $3,492 | $538,000 | $0 | $538,000 |
| 2016 | $3,430 | $490,700 | $0 | $490,700 |
| 2015 | $3,399 | $434,600 | $0 | $434,600 |
| 2014 | $3,277 | $391,000 | $0 | $391,000 |
Source: Public Records
Map
Nearby Homes
- 51 Market St Unit 2
- 244 Norfolk St Unit 244
- 248 Norfolk St Unit 248
- 246 Norfolk St Unit 246
- 222 Columbia St Unit 2
- 30 Union St Unit 1
- 66 Elm St
- 94 Hampshire St Unit B
- 150 Hampshire St Unit 3
- 31 Market St Unit D
- 31 Tremont St
- 294-302 Windsor St
- 43 Lincoln St
- 63 Plymouth St
- 305 Broadway
- 196 Prospect St
- 161 Columbia St Unit 3
- 63 Bristol St Unit 63
- 182 Harvard St Unit 3
- 142 Amory St Unit Front