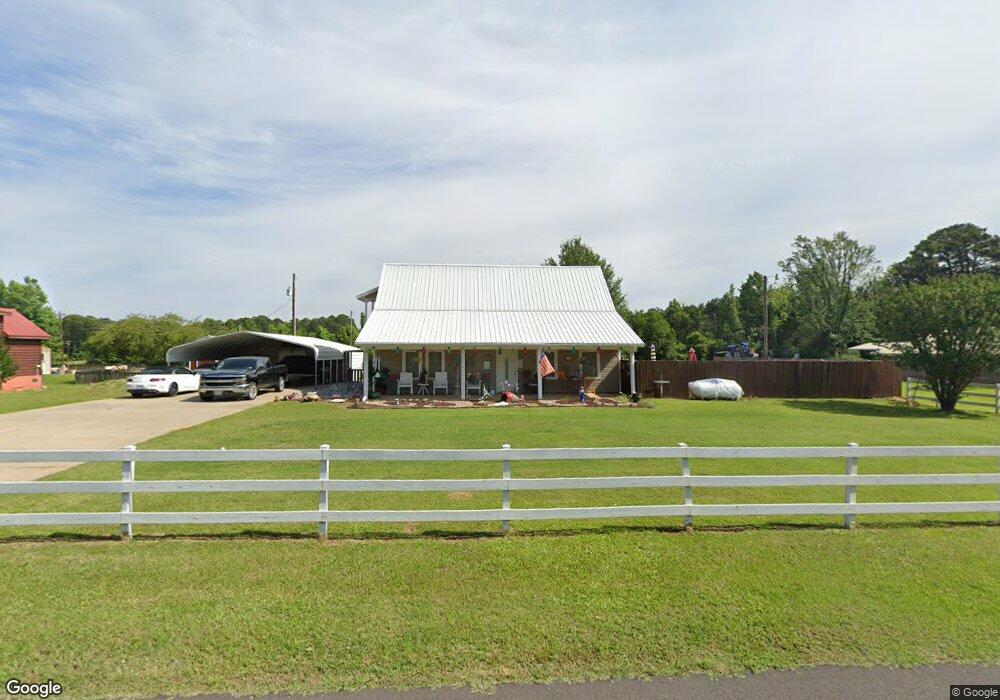
133 Farren Rd Texarkana, TX 75503
Estimated Value: $218,907 - $271,000
--
Bed
--
Bath
1,382
Sq Ft
$177/Sq Ft
Est. Value
About This Home
This home is located at 133 Farren Rd, Texarkana, TX 75503 and is currently estimated at $244,477, approximately $176 per square foot. 133 Farren Rd is a home located in Bowie County with nearby schools including Red Lick Elementary School and Red Lick Middle School.
Ownership History
Date
Name
Owned For
Owner Type
Purchase Details
Closed on
Jun 12, 2019
Sold by
Akin Michael Terry and Akin Tamara
Bought by
Chanley Teresa Diane
Current Estimated Value
Purchase Details
Closed on
Nov 28, 2017
Sold by
Richardson Peggy A
Bought by
Chanley Teresa Diane and Chanley Steven Merle
Home Financials for this Owner
Home Financials are based on the most recent Mortgage that was taken out on this home.
Original Mortgage
$104,000
Interest Rate
3.88%
Mortgage Type
New Conventional
Create a Home Valuation Report for This Property
The Home Valuation Report is an in-depth analysis detailing your home's value as well as a comparison with similar homes in the area
Home Values in the Area
Average Home Value in this Area
Purchase History
| Date | Buyer | Sale Price | Title Company |
|---|---|---|---|
| Chanley Teresa Diane | -- | Twin City Title | |
| Chanley Teresa Diane | -- | Twin City Title Co |
Source: Public Records
Mortgage History
| Date | Status | Borrower | Loan Amount |
|---|---|---|---|
| Previous Owner | Chanley Teresa Diane | $104,000 |
Source: Public Records
Tax History Compared to Growth
Tax History
| Year | Tax Paid | Tax Assessment Tax Assessment Total Assessment is a certain percentage of the fair market value that is determined by local assessors to be the total taxable value of land and additions on the property. | Land | Improvement |
|---|---|---|---|---|
| 2025 | $1,956 | $201,590 | -- | -- |
| 2024 | $1,956 | $183,264 | $24,000 | $165,272 |
| 2023 | $2,901 | $166,604 | $0 | $0 |
| 2022 | $2,698 | $160,858 | $24,000 | $136,858 |
| 2021 | $2,574 | $137,689 | $24,000 | $113,689 |
| 2020 | $2,502 | $132,530 | $24,000 | $108,530 |
| 2019 | $2,486 | $127,606 | $24,000 | $103,606 |
| 2018 | $2,456 | $126,055 | $24,000 | $102,055 |
| 2017 | $2,392 | $123,697 | $24,000 | $99,697 |
| 2016 | $2,382 | $123,197 | $23,500 | $99,697 |
| 2015 | $1,487 | $122,263 | $23,500 | $98,763 |
| 2014 | $1,487 | $118,674 | $23,500 | $95,174 |
Source: Public Records
Map
Nearby Homes
- 24 Silver Hill Dr
- 52 Chesterfield Cir
- TBD Noah Ave
- 23 Steeple View
- 3201 Jason Ln
- 0 Ava Ln
- 18 Country Ln
- 193 Bronco Dr
- 185 Bronco Dr
- 8163 Coyote Trail
- 21 Red Oak Ln
- 14 Lone Star Pkwy
- TBD Arnold Ln
- 5009 Nicholas Dr
- 12 Red Oak Ln
- 8820 W New Boston Rd
- 38 King Rd
- 50 Beaver Lake Dr
- 16 Irongate Dr
- 7 Coppercreek Cir