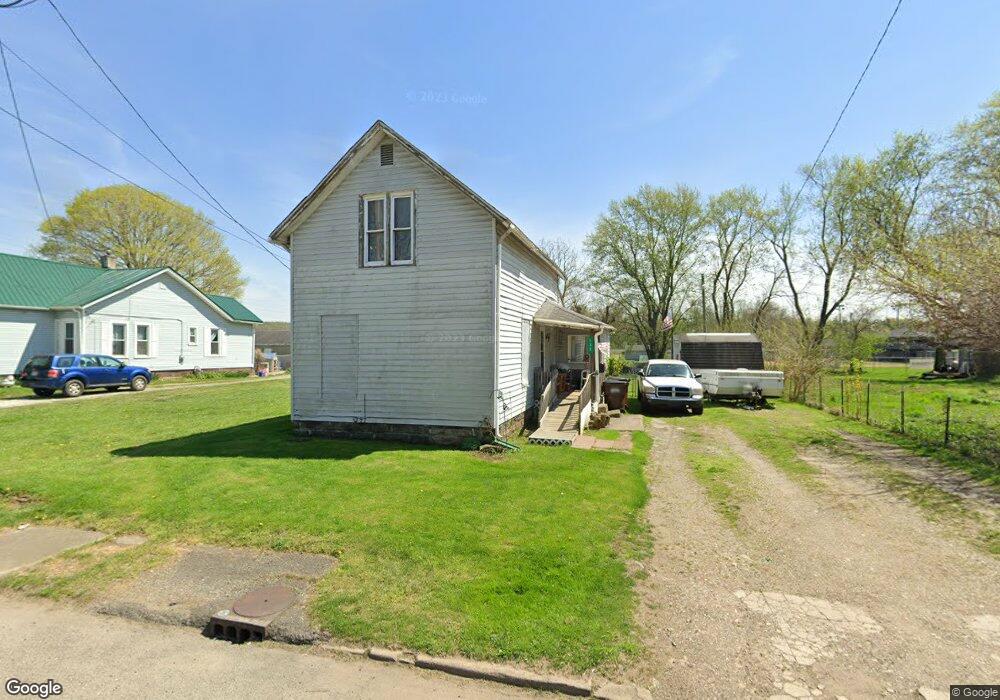
133 Fleek Ave Newark, OH 43055
Estimated Value: $85,000 - $98,000
2
Beds
1
Bath
1,058
Sq Ft
$84/Sq Ft
Est. Value
About This Home
This home is located at 133 Fleek Ave, Newark, OH 43055 and is currently estimated at $89,305, approximately $84 per square foot. 133 Fleek Ave is a home located in Licking County with nearby schools including Ben Franklin Elementary School, Heritage Middle School, and Newark High School.
Ownership History
Date
Name
Owned For
Owner Type
Purchase Details
Closed on
Oct 5, 2004
Sold by
Estate Of Linda R Hartman
Bought by
Hartman Theadore E
Current Estimated Value
Purchase Details
Closed on
Sep 26, 1994
Sold by
Wilbert H Hartman Est
Bought by
Hartman Theadore E and Hartman Linda R
Home Financials for this Owner
Home Financials are based on the most recent Mortgage that was taken out on this home.
Original Mortgage
$10,000
Interest Rate
8.62%
Mortgage Type
New Conventional
Create a Home Valuation Report for This Property
The Home Valuation Report is an in-depth analysis detailing your home's value as well as a comparison with similar homes in the area
Home Values in the Area
Average Home Value in this Area
Purchase History
| Date | Buyer | Sale Price | Title Company |
|---|---|---|---|
| Hartman Theadore E | -- | -- | |
| Hartman Theadore E | $6,350 | -- |
Source: Public Records
Mortgage History
| Date | Status | Borrower | Loan Amount |
|---|---|---|---|
| Previous Owner | Hartman Theadore E | $10,000 |
Source: Public Records
Tax History
| Year | Tax Paid | Tax Assessment Tax Assessment Total Assessment is a certain percentage of the fair market value that is determined by local assessors to be the total taxable value of land and additions on the property. | Land | Improvement |
|---|---|---|---|---|
| 2024 | $285 | $17,720 | $5,850 | $11,870 |
| 2023 | $944 | $17,720 | $5,850 | $11,870 |
| 2022 | $262 | $15,160 | $3,400 | $11,760 |
| 2021 | $275 | $15,160 | $3,400 | $11,760 |
| 2020 | $281 | $15,160 | $3,400 | $11,760 |
| 2019 | $161 | $12,220 | $2,420 | $9,800 |
| 2018 | $161 | $0 | $0 | $0 |
| 2017 | $437 | $0 | $0 | $0 |
| 2016 | $339 | $0 | $0 | $0 |
| 2015 | $347 | $0 | $0 | $0 |
| 2014 | $443 | $0 | $0 | $0 |
| 2013 | $333 | $0 | $0 | $0 |
Source: Public Records
Map
Nearby Homes
Your Personal Tour Guide
Ask me questions while you tour the home.