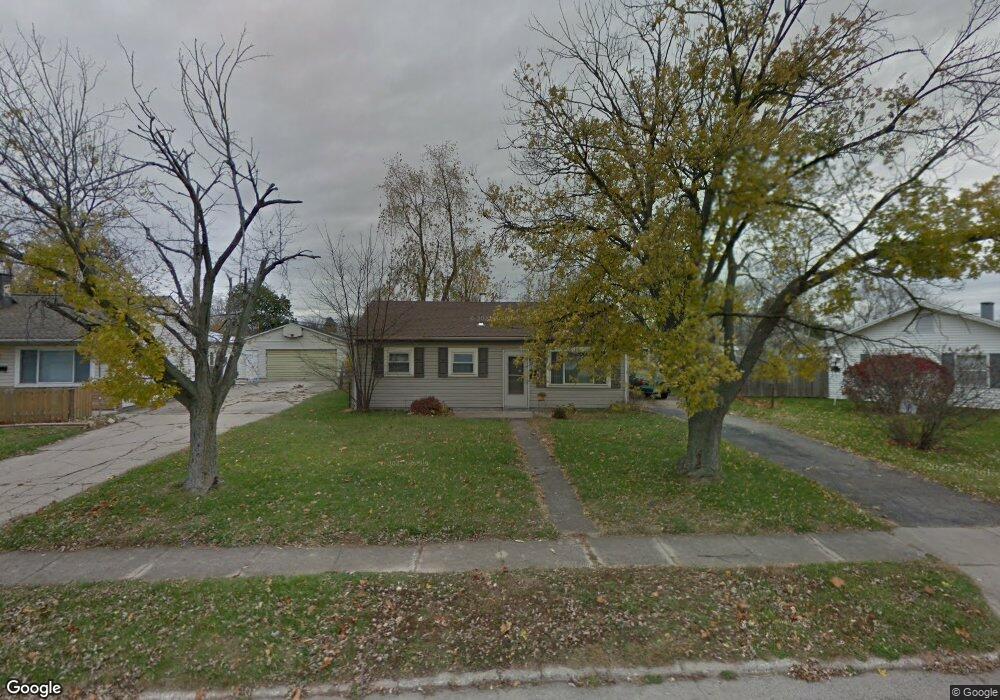
133 Foley Dr Vandalia, OH 45377
Estimated Value: $160,000 - $172,000
3
Beds
1
Bath
875
Sq Ft
$188/Sq Ft
Est. Value
About This Home
This home is located at 133 Foley Dr, Vandalia, OH 45377 and is currently estimated at $164,732, approximately $188 per square foot. 133 Foley Dr is a home located in Montgomery County with nearby schools including Demmitt Elementary School, Smith Middle School, and Butler High School.
Ownership History
Date
Name
Owned For
Owner Type
Purchase Details
Closed on
Oct 15, 2009
Sold by
Secretary Of Housing & Urban Development
Bought by
Hamilton Jeffery W
Current Estimated Value
Purchase Details
Closed on
Aug 26, 2008
Sold by
Isaacs Cassandra M
Bought by
Secretary Of Housing & Urban Development
Purchase Details
Closed on
May 19, 2006
Sold by
Stammen Timothy C and Stammen Kathleen M
Bought by
Isaacs Cassandra M
Home Financials for this Owner
Home Financials are based on the most recent Mortgage that was taken out on this home.
Original Mortgage
$78,591
Interest Rate
6.62%
Mortgage Type
FHA
Purchase Details
Closed on
Oct 17, 1997
Sold by
Rossbach Todd E and Rossbach Cindy R
Bought by
Hardin John B
Purchase Details
Closed on
Feb 21, 1997
Sold by
Rossbach Jerry Miles and Rossbach Kim
Bought by
Rossbach Todd E and Rossbach Cindy R
Create a Home Valuation Report for This Property
The Home Valuation Report is an in-depth analysis detailing your home's value as well as a comparison with similar homes in the area
Home Values in the Area
Average Home Value in this Area
Purchase History
| Date | Buyer | Sale Price | Title Company |
|---|---|---|---|
| Hamilton Jeffery W | $47,000 | Lakeside Title & Escrow Agen | |
| Secretary Of Housing & Urban Development | $46,000 | None Available | |
| Isaacs Cassandra M | $83,900 | Vantage Land Title Inc | |
| Hardin John B | $75,000 | -- | |
| Rossbach Todd E | $64,000 | -- |
Source: Public Records
Mortgage History
| Date | Status | Borrower | Loan Amount |
|---|---|---|---|
| Previous Owner | Isaacs Cassandra M | $78,591 |
Source: Public Records
Tax History Compared to Growth
Tax History
| Year | Tax Paid | Tax Assessment Tax Assessment Total Assessment is a certain percentage of the fair market value that is determined by local assessors to be the total taxable value of land and additions on the property. | Land | Improvement |
|---|---|---|---|---|
| 2024 | $2,065 | $39,390 | $11,470 | $27,920 |
| 2023 | $2,065 | $39,390 | $11,470 | $27,920 |
| 2022 | $1,621 | $24,930 | $7,260 | $17,670 |
| 2021 | $1,622 | $24,930 | $7,260 | $17,670 |
| 2020 | $1,617 | $24,930 | $7,260 | $17,670 |
| 2019 | $1,565 | $22,100 | $7,260 | $14,840 |
| 2018 | $1,568 | $22,100 | $7,260 | $14,840 |
| 2017 | $1,556 | $22,100 | $7,260 | $14,840 |
| 2016 | $1,507 | $21,020 | $7,260 | $13,760 |
| 2015 | $1,488 | $21,020 | $7,260 | $13,760 |
| 2014 | $1,488 | $21,020 | $7,260 | $13,760 |
| 2012 | -- | $24,030 | $7,260 | $16,770 |
Source: Public Records
Map
Nearby Homes
- 214 Marview Ave
- 365 Inverness Ave
- 314 N American Blvd
- 92 Waller Ave
- 552 Tionda Dr N
- 1015 van Arden Dr
- 0 Northwoods Blvd
- 113 Village Trail Dr Unit 6
- 113 Village Trail Dr Unit 2B
- 50 Clubhouse Way
- 2014 Waterfall Ln
- 2082 Waterfall Ln
- 2050 Old Falls Dr
- 2070 Settlers Trail Unit UN2070
- 2010 Settlers Trail
- 775 Cassel Creek Dr
- 461 Poplar Grove Dr
- 106 Grosbeck St
- 416 Attica St
- 545 Koch Ave